Call yourself a forecaster and you’re sure to get some dirty looks. It’s a cultural tradition, at least in the parts of our country that has seasons, to criticize the accuracy of a weather forecast (you call this partly cloudy, Mabel?). Political pundits–you know, the guys in the bowties–are ranked somewhere between child molester and petty thief on the social hierarchy. The stock market analysts that were the toast of the town just a couple of years ago are now seen as charlatans at best, criminals at worst.
My name is Nate, and I am a forecaster. I forecast how baseball players are going to perform. And I pretty much get the worst of it. Tell somebody that their childhood hero is going to hit .220 next year, or that the dude they just traded away from their fantasy team is due for a breakout, and you’re liable to get called all kinds of names. A bad prediction will inevitably be thrown in your face, (see also: Pena, Wily Mo) while a good one will be taken as self-evident, or worse still, lucky.
The truth is, though, that those of us who make it our business to forecast the performance of baseball players have it pretty easy. For one thing, we’ve got an awesome set of data to work with; baseball statistics are almost as old as the game itself, and the records, for the most part, are remarkably accurate and complete. For another, it’s easy to test our predictions against real, tangible results. If we tell you that Adam Dunn is going to have a huge season, and instead he’s been demoted to Chattanooga after starting the year 2-for-53, the prediction is right there for everyone to see in all its manifest idiocy. Not so in many other fields, where the outcomes themselves are more subject to interpretation.
In fact, baseball forecasters are a pretty spoiled lot. We don’t have to deal with an intrinsically chaotic system, like weather forecasters do, or with the whimsy of politics or psychology. One of the unavoidable truths about being spoiled is that it’s going to make you lazy, and for years, baseball forecasters were a lazy bunch. It’s possible to come up with a pretty good forecast simply by looking at how a player has performed in the past three seasons, adjusting it upward or downward slightly for his age, and maybe applying a park effect. As a player has performed in the past, so he will perform in the future; it’s sunny today, and so it will be sunny tomorrow.
Let’s redirect our abstraction for moment and consider what a baseball forecaster has to work with. Data are our fuel; what do these data look like? Well, something like this:

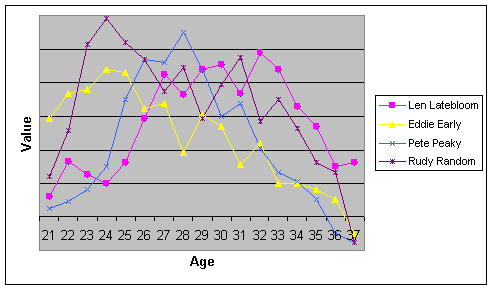
What we’ve got here is the performance of four baseball players over the course of their careers. We’ve got their age running from left to right, and their Value–that could mean OPS, runs created, Equivalent Average, whatever you care for–running from top to bottom. What we’ve also got is a bloody mess. The lines criss and cross seemingly at random; the performance of an individual player varies wildly from year to year–this is what the data look like. If you squint hard enough, you might notice that the players tend to do better in the middle of their careers than at the beginning or the end, but even that is easy to lose in this swamp of randomness.
And then some smart person with an MBA came along and invented the Average.

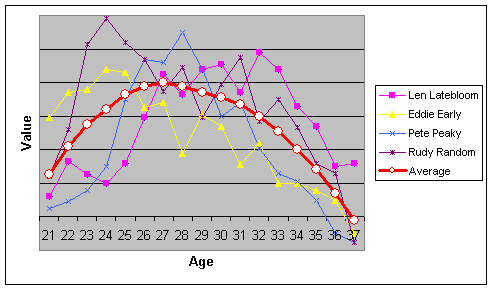
Take the average value of the four players in our chart, and you come up with a perfectly well-behaved curve that conforms with more or less all of the usual assumptions about the progress that a major league baseball player is likely to experience over the course of his career. He starts out slowly upon his debut, improves rapidly through his early 20s, reaches his peak at age 26 or 27, and then begins his decline, which is slow at first but soon becomes more rapid. It all looks nice and orderly, and it is curves like this that many forecasting systems are predicated upon. We expect a player’s productivity to decrease, say, by 3% between age 29 and age 30, and get very mad at our forecasting systems when he doesn’t.
The trouble is that, if you look a bit more closely, you’ll see that the ‘average’ curve doesn’t do a particularly good job of outlining the career path of any of the four players in our sample. On the one hand, you’ve got a player like Eddie Early, who has his best year at age 24 and spends a lifetime trying to recall the glory of his youth. On the other, there’s the legendary Larry Latebloom, who isn’t finished improving until his 30th birthday has passed. It is possible to think of any number of real-life baseball players who fall into one of these categories–say, Ben Grieve in the former, and Jeff Kent in the latter.
Like snowflakes, every ballplayer is different; it should be clear that the ‘average’ career path is merely an abstraction. Ben Grieve was 27 last year…did anybody really expect him to have the best season of his career? At the same time, certain ballplayers share certain commonalities: We might group a set of players into a class called ‘slap-hitting middle infielders’, another set into ‘power-hitting outfielders with good speed’, and so forth. If we found that players within a given group tended to experience a career path similar to one another, but different from those in other groups–well, that would tell us something. This, in fact, is what Baseball Prospectus’ PECOTA system tries to do.
But first things first: We need to clean up our data a little bit. Forecasting would be more straightforward if we knew the ‘true’ value–that is, the innate level of ability–of a given player at each point in his career. If we knew exactly how good a player was at age 28, we could probably do a pretty good job of figuring out how good he is likely to be at age 29.
This isn’t as easy as it sounds, however, because the evidence that we use in order to measure how good a player is tainted. Specifically, this set of data is subject to the random fluctuations intrinsic to a limited sample size.
Suppose we take a player who we ‘know’ will hit a home run exactly every 20 at bats–so, in a season of 500 AB, we’d expect him to hit 25 dingers. Card games like Strat-O-Matic and computer simulations work this way. If we simulated the results of 10 seasons–that is, if we rolled a die 500 times to represent each of his at-bats, and the die had a one-in-20 chance of landing on ‘home run’–we might wind up with a series of home run totals that looked like this:
28
23
29
33
18
25
23
30
26
24
Though the results tend to gravitate around the number 25, they vary substantially from year to year: The same player, with exactly the same set of skills, could easily hit 18 home runs in one season, and 33 in the next, purely as the result of chance. The trouble is that, in the real world, we only have one season to work with. If we come up with the season in which the player hit 33 homers, or the season in which he hit 18, we could easily misstate his value, and make a bad prediction for what he’s likely to do going forward.
Getting rid of this sort of randomness is not an easy process. We can improve our dataset by accounting for things like league and park effects–and account for them we do–but even then, the randomness persists. One other thing that a forecaster can do to make his life a little easier is to consider a player’s results in the context of other indicators. For example, suppose that in a season in which a player hit 33 home runs, putting him among the league leaders, he managed only 16 doubles, one of the lowest totals in the league. Because hitting doubles and hitting home runs involves many of the same skills–e.g., hitting the ball hard–that would be an odd result. It would suggest that either the player was ‘lucky’ to have hit as many home runs as he did, that he was ‘unlucky’ to hit such a paltry number of doubles. Or, more likely, some combination of both.
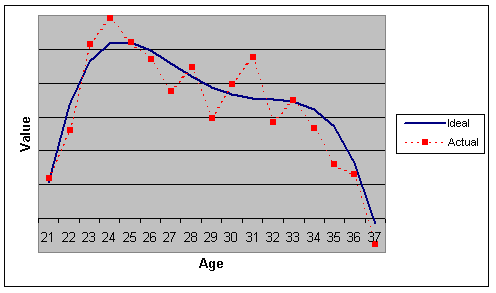
A good forecasting system, like PECOTA, looks at a whole series of these sorts of indicators in an attempt to improve its understanding of the player’s true level of ability. The result of that process is something like this:

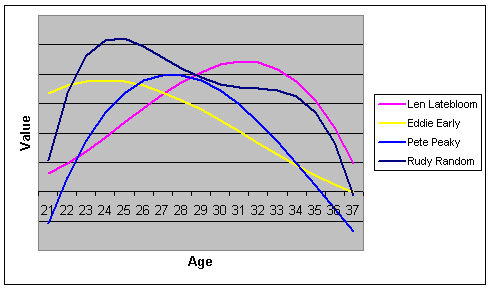
That is, we are seeking to get rid of the sorts of fluctuations that characterize the red line–the player’s actual performance–in order to get at something that looks like the blue line–the player’s natural level of ability, with a smoother progression over time. Once we’ve accomplished that as best we can–and we can never accomplish it perfectly–it is possible to move forward. We would be able to come up such a career progression for any player that we cared to:

The question then becomes: Which of these historically established tracks provides for the most pertinent information? PECOTA answers that question by means of similarity scores. It determines, firstly, the relative importance of various factors in deciding how a player progresses from one year to the next, and secondly, which historical players fit this profile best. A slow third baseman who draws a lot of walks will be compared, mostly, with other slow third basemen who draw a lot of walks (Robin Ventura, anyone?). If there is something characteristic about the way this ‘type’ of player progresses over time, it will emerge organically from this process, and will be reflected in a player’s forecast.
This procedure requires us to become comfortable with probabilistic thinking. While a majority of players of a certain type may progress a certain way–say, peak early–there will always be exceptions. Moreover, the comparable players may not always perform in accordance with their true level of ability. They will sometimes appear to exceed it in any given season, and other times fall short, because of the sample size problems that we described earlier.
PECOTA accounts for these sorts of factors by creating not a single forecast point, as other systems do, but rather a range of possible outcomes that the player could expect to achieve at different levels of probability. Instead of telling you that it’s going to rain, we tell you that there’s an 80% chance of rain, because 80% of the time that these atmospheric conditions have emerged on Tuesday, it has rained on Wednesday.
Surely, this approach is more complicated than the standard method of applying an age adjustment based on the ‘average’ course of development of all players throughout history. However, it is also leaps and bounds more representative of reality, and more accurate to boot.
Forecasting has come of age. There is real science behind these things, provided that you take the time to apply it.
Now, where did I put my bowtie?
Thank you for reading
This is a free article. If you enjoyed it, consider subscribing to Baseball Prospectus. Subscriptions support ongoing public baseball research and analysis in an increasingly proprietary environment.
Subscribe now