A very interesting story was published online on June 10, entitled “Have Progressive Field upgrades created a home run ‘wind tunnel’?”. The article talks about changes made to Progressive Field during the last offseason and how those changes may be the reason for the sharp increase in home runs in Cleveland this year. There is speculation that the changes to the outfield stands in both right and left field may lead to stronger out-blowing wind currents that propel fly balls further, resulting in more home runs. The author, Joe Noga, had contacted one of us a week or so earlier to ask whether the “wind tunnel” hypothesis is valid. If you look towards the end of the Noga article, you will see the account of that interview. Not having been aware of the issue prior to then, the best we could say was that such a theory is plausible in the following sense: Changes to the stadium structure could lead to changes in wind currents, and those changes in wind currents could lead to more home runs. We emphasized that while the theory is plausible, to prove or disprove it would require some serious analysis. What followed was our attempt at serious analysis, which we report on in this article.
As a starting point, it is useful to document the changes in home run rates on balls in play over the past several years, which are documented in Fig. 1. While the rates for all MLB parks stayed fairly constant during the period 2022-2024, there is a striking jump in the rate in Cleveland in 2024. Presumably it is that increase that has caused speculation about the wind-tunnel theory.
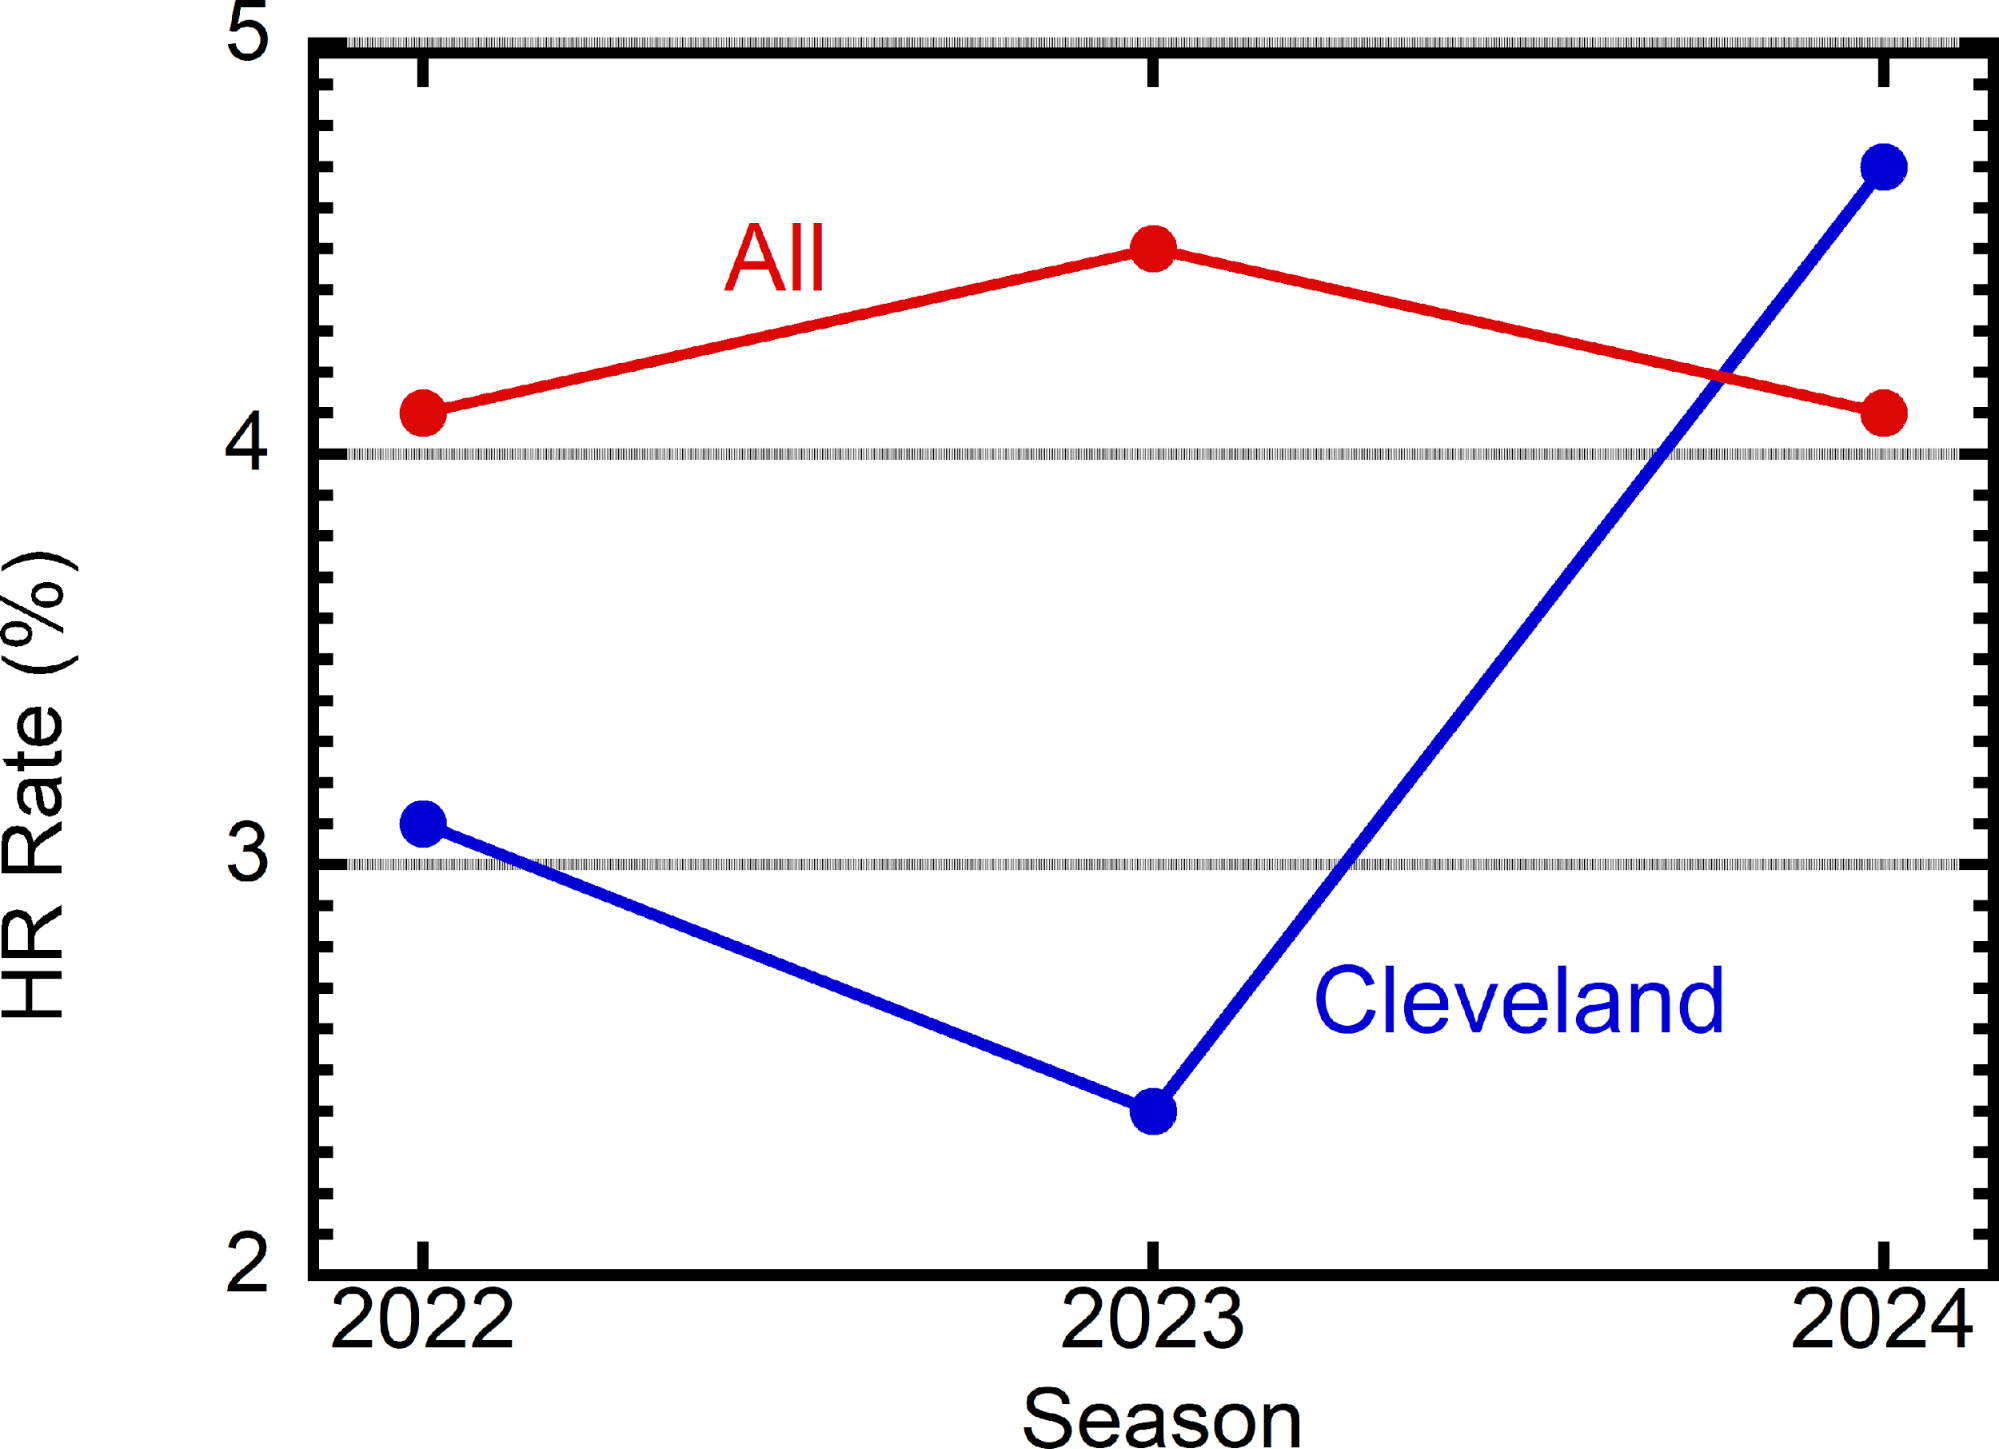
FIG. 1. Home runs per ball-in-play for Cleveland and for all MLB parks, from the start of each season through June 15.
The difficulty with simply looking at home run totals is that there’s always the argument that the Guardian batters are simply better this year. They are hitting the ball harder, perhaps more often and at a more optimum launch angle, resulting in more home runs. To exclude that possibility requires a different approach.
The analysis we present here is designed to more directly address the wind tunnel hypothesis by investigating the “carry” of a baseball. By “carry” we mean the distance the fly ball travels for given launch parameters. It makes no difference how the batter achieved those launch parameters or whether José Ramírez has significantly improved his batting this year. We are only looking at what happens to the ball once it leaves the bat. If there is an out-blowing wind, it will travel farther, resulting in more home runs; if an in-blowing wind, it will travel less far, resulting in fewer home runs.
Our plan of attack is to use publicly available Statcast data to investigate the carry of a fly ball by looking at both fly ball distances and home run rates for fixed launch conditions. Regarding the wind tunnel hypothesis, what will be most relevant is whether there is evidence for improved carry at Progressive Field in 2024 relative to the previous two seasons. If there is an increase in distances and/or home runs, that means the ball carries better and supports–but does not necessarily prove (more on this later)–the wind tunnel hypothesis, independent of the quality of the batters.
We first need to ask what are the launch parameters that determine fly ball distances. This particular question was addressed by one of us in an unpublished article from a few years ago, where it was found that there are four relevant launch parameters: exit velocity, launch angle, spin rate (i.e., rpm), and spin axis, where the latter determines the proportions of the spin that are backspin and sidespin.
We first investigate home run rates using a technique identical to the one we used two years ago and described in this article. We use games from all MLB parks other than Progressive Field as our reference data, to which we fit a generalized additive model (GAM) for each season separately. The GAM relates the probability of a home run to a smooth function of the launch parameters. Ideally, all the relevant launch parameters would be used. Unfortunately, that is somewhat problematic, since the batted ball spin rate and spin axis are not publicly available. Accordingly, for this analysis, we use only exit velocity and launch angle, in addition to game-time temperature, which can have an important effect on home run probability.
Having fitted a model based on the other parks, we then apply that model to the Progressive Field data to predict a home run probability based on the launch variables for each ball in play. Summing all these probabilities, we arrive at a predicted home run total, from which we find a predicted home run rate. This prediction can be compared directly with the actual home run rate. If the carry of a fly ball were the same in Cleveland as in the rest of the parks, the predicted rate would be close to the actual rate. The comparison is shown in Fig. 2. For 2022 and 2023, the predicted and actual rates are quite close. However, in 2024 the actual home run rate exceeds the predicted rate, showing that the fly ball carry in Cleveland during the current season is significantly better than elsewhere. The predicted number of home runs for 2024 is 52, whereas the actual number is 68, an increase of 30%.
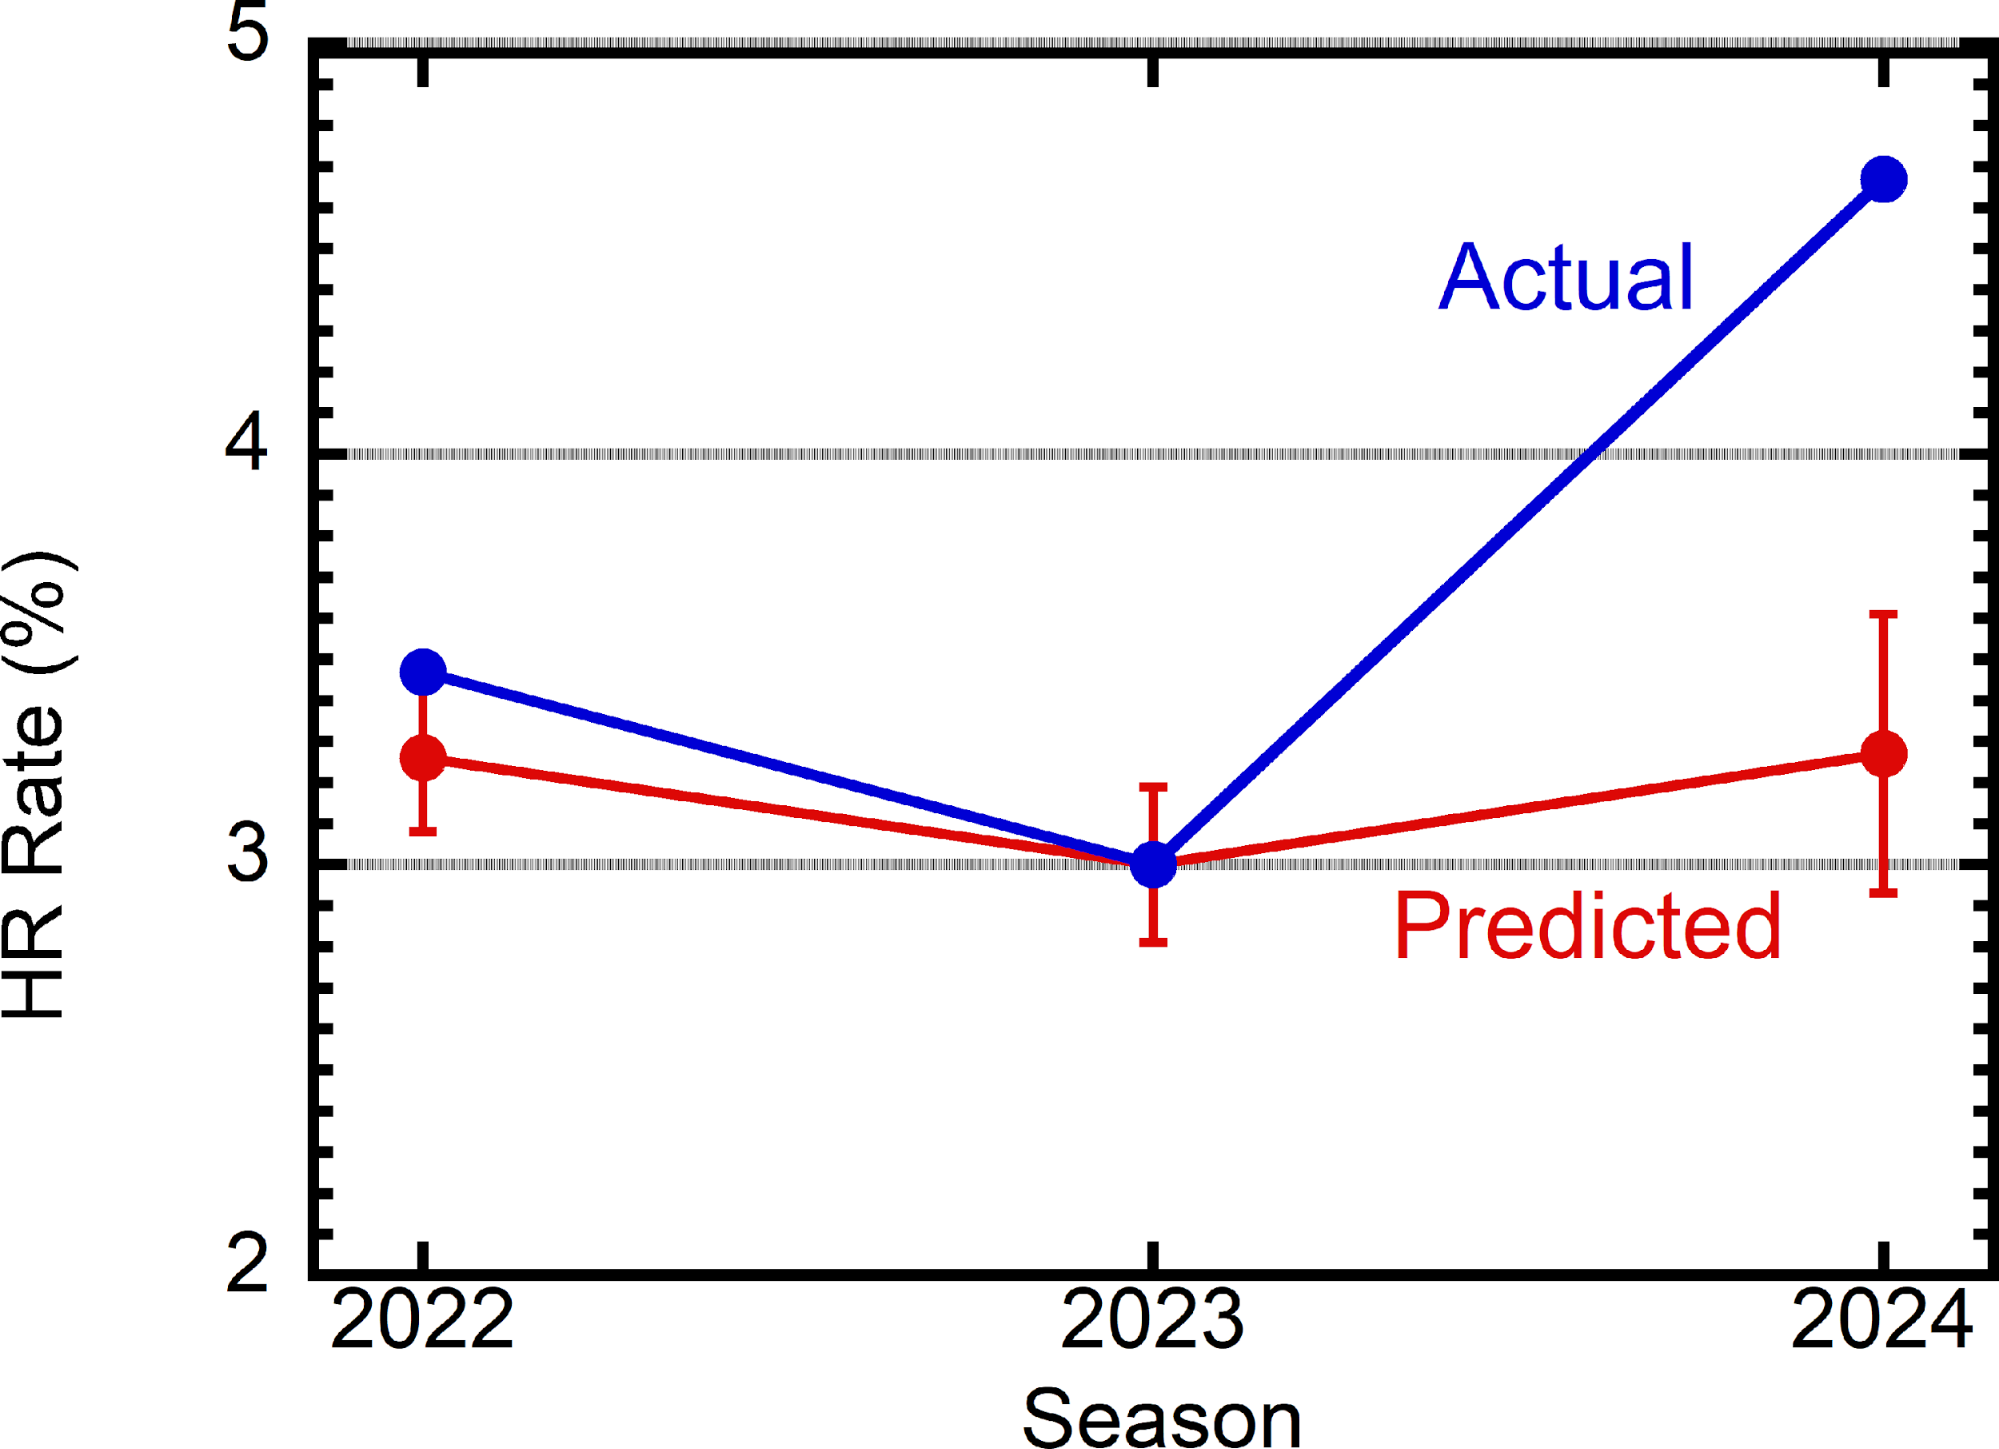
FIG. 2. Predicted and actual home run rates for Progressive Field, based on a generalized additive model fitted to data from the other MLB parks. The vertical bars are standard errors.
We next turn to fly ball distances. An analysis similar to that just described for home runs can also be applied to fly ball distances. The essential idea is the same: We ask whether fly ball distances in 2024 are different from those in 2022 or 2023, assuming identical launch conditions. We could investigate this question for a whole range of different launch conditions, but for the sake of simplicity we will confine ourselves to those launch conditions leading to the largest distances. These are launch angles in the range 25-30 degrees and exit velocities in the range 90-110 mph. For these “home-run-friendly” launch conditions, the fly ball distance depends linearly on exit velocity, as shown in Fig. 3, with a slope of about 5 ft/mph. Note that there is considerable scatter of the points about the linear fit, a feature we will return to shortly.
Guided by these considerations, we perform a linear fit of distance with inputs exit velocity, season (2022, 2023, 2024), and game-time temperature. We assume a common slope for both exit velocity and temperature for the three seasons and different season- dependent intercepts. Estimates for the difference-in-seasons effect are displayed in Table I, where we find that fly balls in Cleveland in our home-run-friendly range of exit velocities and launch angles traveled 8.0±2.4 and 12.9±2.9 feet farther in 2024 than in 2023 and 2022, respectively. We then did an identical analysis for every MLB stadium, with the results also shown in Table I and in Fig. 4. The latter clearly shows that Cleveland is an outlier.

FIG. 3. Distance vs. exit velocity for launch angles in the range 250 − 300, with the red line being a linear fit with slope 5.6 ft/mph. The data are from the 2023 season.
TABLE I. Estimates of the difference-in-seasons effect in fly ball distance (∆) and standard errors (err) between seasons 2024 and either 2023 or 2022 for balls hit in Cleveland and in all of MLB. The data are for launch angles in the range 250 − 300 and for exit velocities in the range 90-110 mph. The z values are the ratio of ∆ to err.
| Cleveland | All | |||
| Seasons | ∆ ± err
(ft) |
z | ∆ ± err
(ft) |
z |
| 2024-2023
2024-2022 |
8.05 ± 2.43
12.87 ± 2.52 |
3.31
5.11 |
-1.87 ± 2.42
-0.31 ± 2.47 |
-0.76
-0.12 |

FIG. 4. Plot of z values for each MLB venue, where z represents the ratio of the estimate of the difference-in-seasons effect divided by the standard error from the regression model relating distance with exit velocity, season, and temperature. The red line is the MLB average and the red dot highlights Cleveland.
The preceding analyses for both home run rates and distances of home-run-friendly fly balls show that the carry in Cleveland has increased significantly in 2024 relative to the preceding two seasons and relative to the rest of the league. That was our original goal. However, it is important to note the considerable scatter–about 19 ft root-mean-square–of the points about the linear fit in Fig. 3, suggesting that there are additional factors affecting carry which were not taken into account in our fitting. One such factor is wind. However, it is premature to conclude that wind is the primary factor since, as already noted above, both spin rate and spin axis also play an important role in the carry of a fly ball. Variation in these spin parameters across seasons and/or across MLB parks cannot be ruled out as a reason for the change in carry in Cleveland in 2024. So while we cannot rule out the wind tunnel hypothesis, we cannot confirm it either. Hopefully the new technologies that determine wind speed and direction in MLB parks will shed new light on the subject.
Jim Albert is Emeritus Professor, Department of Mathematics and Statistics, Bowling Green State University.
Alan M. Nathan is Professor Emeritus of Physics at the University of Illinois, Urbana-Champaign.
Thank you for reading
This is a free article. If you enjoyed it, consider subscribing to Baseball Prospectus. Subscriptions support ongoing public baseball research and analysis in an increasingly proprietary environment.
Subscribe now