There’s an adage—well, at least I think there’s an adage, and if there’s not I’m going to straw man the heck out of it anyway, because it set me down an interesting path—that if you’re going to “get” an opposing team’s ace, you’ve got to get ‘em early or not at all. The logic, I imagine, goes something like this: aces have great stuff, so if you allow them to settle in without scoring against them, you’re not going to be able to score at all later. Which, like the logic behind so many adages, sounds perfectly reasonable until you subject it to data.
Since the beginning of the 1953 season (which is as far back as our database goes) and running through the end of 2015, teams have scored 661,464 runs against starting pitchers, in any inning of any game. Of those 661,464 runs, 221,354 have been scored in the first two innings of the game, or what we’ll call here (for the purposes of discussion) “early.” The numerate among you will recognize that 221,354 divided by 661,464 is approximately 33.5 percent. There’s more to the data, though: 33.5 percent is the mean over the sample, but the year-to-year value has been steadily climbing for some time now, though with perhaps a bit of a leveling-off beginning around the mid-1990s.
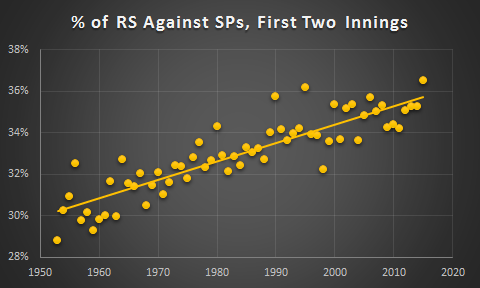
There’s a story here about why the numbers are shooting up across the board, so let’s talk about that for a minute. Turns out to be simple math: As starters increasingly throw fewer innings per start than they have in the past, a higher percentage of all their innings pitched, in general, come in innings one and two. Put differently, if starters are only throwing six-ish innings a game, as they indeed are these days, there are two fewer innings past the second in which to allow runs than there were when they threw eight-ish innings a game, as they did in 1953. That drives up the percentage of runs scored in the first two innings quite naturally. So, there you go. That’s why the trendline is sloping upward. Let’s get back to the aces, though, because they’re who we’re after. Do they do things any differently than their normal compatriots?
First, some definitions. Let’s define an ace as one of the top 10 starting pitchers by WARP in any given year. These pitchers, since 1953, have given up 51,388 runs, or 7 percent of the overall total. So, how do those pitchers do in the early going of their starts? Is it very different from what other starting pitchers do? If the adage is correct, and you have to get to aces early or not at all, we should expect to see a very high percentage of runs scored against aces to come in innings one and two; higher, in fact, than the 33.5 percent we saw scored against the general population of pitchers in that same phase of the game. Is that what we see?
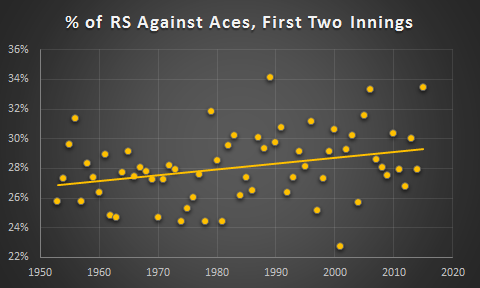
In a word? No. In four words: This might be interesting. The mean here is 28.1 percent, which is—repeat after me—lower than 33.5 percent, and thus precisely the reverse of what we expected to see coming into it. Case closed? Not quite: The same rising trend that we saw above exposes a problem with our data here. Fact is, aces pitch more innings per start than other pitchers in the sample, and so have even more available innings past the second in which to give up runs and drive down their percentage of early runs. Again, it’s hard to give up eighth-inning runs if you’re not pitching in the eighth inning.
So the approach we’ve used so far, where we look at the percentage of runs given up by aces and non-aces, is pretty misleading, because aces pitch deeper into games than other pitchers (they’re good, so they get left in), thus driving down their percentage of early runs allowed. So we need a different approach—one that keeps the same numerator (runs) but establishes a standard denominator.
Let’s look, therefore, at the average number of runs given up in each inning of a standard nine-inning game by each category of pitcher. That way, the denominators are the same: only pitchers who threw in the first inning are considered in the first inning bucket, and only pitchers who threw in the seventh are considered in the seventh-inning bucket, and so on. Make sense? Here we go:
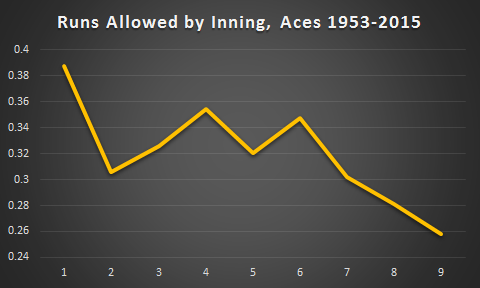
The way to interpret this is to say that (for example), since 1953, aces have given up an average of 0.39 runs in the first inning, and an average of 0.26 runs in the ninth. So, wow! The adage is true! You do have to get ‘em early, because aces, in general, get better as the game goes on. Except, here’s this:

Hey, look, turns out you have to get regular pitchers early too! The lines here are smoother, because there’s more data in the sample, but it’s the same downward trend. And, when you think about it, it makes sense that both categories would show a downward slope: It’s not actually that pitchers get better as the game goes on, it’s that pitchers who are bad early get lifted, and so selection bias drives the average runs allowed down as you move through the innings. And here’s the important thing, when it comes to proving or disproving our adage: The slopes aren’t the same for each graph. Here’s the two together, on the same scale:
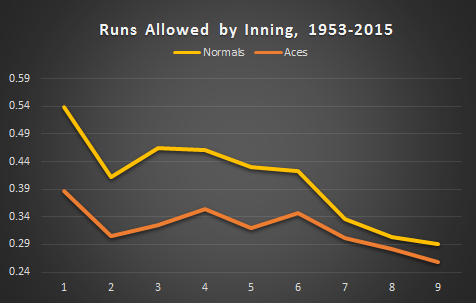
Turns out that the slope for non-Aces is actually steeper than it is for Aces—in other words, exactly the reverse of the adage is true, if anything. And why is that? First of all, I don’t know. But second of all, I have a guess, and that’s this: Managers react differently to aces pitching poorly than they do to non-aces doing the same thing.
In 2015, aces—again, defined as the top 10 pitchers of the year, by WARP—were pulled from games directly after allowing a run 28.5 percent of the time (the other 71.5 percent of the time, they left after a scoreless inning, or by virtue of the game ending). By contrast, non-aces departed after an inning in which they allowed a run 37.6 percent of the time. In other words, the elasticity of demand for more innings from starters is higher for non-aces than it is for aces. Managers see an ace give up a run, and they (72 percent of the time) go, “Meh, let’s leave him out there and see how he does.” For a non-ace? They yank him nearly 32 percent more often. And it wasn’t just 2015: The ratio stays basically constant from 1953 to present. Hence, the flatter slope for aces.
So, what have we learned here today? We’ve learned that there’s really nothing to the idea that you have to get an ace early. If a pitcher is pitching well, his manager will leave him in, thus creating selection bias for runs allowed by starters in late innings. That’s why the adage came to be in the first place. But there’s no real difference between aces and “normals” in this respect—if anything, aces are more likely to be left in after failure by their managers, and therefore give opposing offenses more shots to “get them” late. So, sorry, adage. It’s time for the dustbin.
Oh, and one last thing: We’ve also learned that pitchers these days just don’t throw as many innings as they did before, and that’s driving up the percentage of their runs they’re allowing early. Damn millennials ruining the game of baseball.
Thanks are due to Rob McQuown and Reggie Yinger for research assistance.
Thank you for reading
This is a free article. If you enjoyed it, consider subscribing to Baseball Prospectus. Subscriptions support ongoing public baseball research and analysis in an increasingly proprietary environment.
Subscribe now
I think it's interesting that the curve for the "regular" pitchers slopes up more quickly in the 3rd inning, likely suggesting the regular pitchers are less efficient in innings 1-2 and are back to the top of the order in the 3rd inning. Whereas the aces are doing better and not facing the top of the order again until the 4th.