| Player | Player Sort | Pos | Salary | Salary Sort | Pct | Pct Sort | WARP | WARP Sort | WARP/$M | WARP/$M Sort | $/WARP | $/WARP Sort | Current Status |
|---|
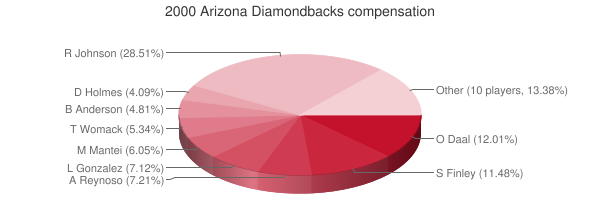
 Randy Johnson
 |
Johnson Randy |
RP |
$13,350,000 |
13350000 |
16.93% |
16.93 |
10.56 |
10.5564 |
0.79 |
0.79074157303371 |
$1,264,636 |
1264635.6712516 |
|
 Matt Williams
 |
Williams Matt |
3B |
$8,500,000 |
8500000 |
10.78% |
10.78 |
0.58 |
0.578494 |
0.07 |
0.068058117647059 |
$14,693,324 |
14693324.390573 |
|
 Todd Stottlemyre
 |
Stottlemyre Todd |
RP |
$8,000,000 |
8000000 |
10.14% |
10.14 |
2.68 |
2.67704 |
0.33 |
0.33463 |
$2,988,375 |
2988375.2203927 |
|
 Jay Bell
 |
Bell Jay |
2B |
$7,040,000 |
7040000 |
8.93% |
8.93 |
0.53 |
0.534398 |
0.08 |
0.075908806818182 |
$13,173,702 |
13173701.997388 |
|
 Omar Daal
 |
Daal Omar |
RP |
$5,625,000 |
5625000 |
7.13% |
7.13 |
0.45 |
0.446082 |
0.08 |
0.079303466666667 |
$12,609,789 |
12609789.231576 |
|
 Steve Finley
 |
Finley Steve |
CF |
$5,375,000 |
5375000 |
6.82% |
6.82 |
3.75 |
3.75358 |
0.70 |
0.69834046511628 |
$1,431,966 |
1431966.2828553 |
|
 Bernard Gilkey
 |
Gilkey Bernard |
PH |
$5,250,000 |
5250000 |
6.66% |
6.66 |
-0.80 |
-0.804074 |
— |
0 |
— |
0 |
|
 Armando Reynoso
 |
Reynoso Armando |
RP |
$3,375,000 |
3375000 |
4.28% |
4.28 |
1.96 |
1.96456 |
0.58 |
0.58209185185185 |
$1,717,942 |
1717941.9310176 |
|
 Luis Gonzalez
 |
Gonzalez Luis |
LF |
$3,333,333 |
3333333 |
4.23% |
4.23 |
4.06 |
4.06341 |
1.22 |
1.2190231219023 |
$820,329 |
820328.98476895 |
|
 Matt Mantei
 |
Mantei Matt |
RP |
$2,831,000 |
2831000 |
3.59% |
3.59 |
0.16 |
0.156905 |
0.06 |
0.055423878488167 |
$18,042,765 |
18042764.730251 |
|
 Tony Womack
 |
Womack Tony |
SS |
$2,500,000 |
2500000 |
3.17% |
3.17 |
0.82 |
0.817776 |
0.33 |
0.3271104 |
$3,057,072 |
3057071.8631997 |
|
 Brian Anderson
 |
Anderson Brian |
RP |
$2,250,000 |
2250000 |
2.85% |
2.85 |
3.85 |
3.84774 |
1.71 |
1.7101066666667 |
$584,759 |
584758.84545214 |
|
 Darren Holmes
 |
Holmes Darren |
RP |
$1,916,667 |
1916667 |
2.43% |
2.43 |
0.05 |
0.0521504 |
0.03 |
0.027208899615844 |
$36,752,681 |
36752680.708106 |
|
 Greg Swindell
 |
Swindell Greg |
RP |
$1,833,333 |
1833333 |
2.32% |
2.32 |
1.52 |
1.52341 |
0.83 |
0.83095106017292 |
$1,203,440 |
1203440.3082558 |
|
 Dan Plesac
 |
Plesac Dan |
RP |
$1,500,000 |
1500000 |
1.90% |
1.90 |
0.96 |
0.964307 |
0.64 |
0.64287133333333 |
$1,555,521 |
1555521.2188649 |
|
 Lenny Harris
 |
Harris Lenny |
3B |
$1,100,000 |
1100000 |
1.39% |
1.39 |
-0.97 |
-0.968422 |
— |
0 |
— |
0 |
|
 Greg Colbrunn
 |
Colbrunn Greg |
1B |
$1,005,000 |
1005000 |
1.27% |
1.27 |
1.31 |
1.3143 |
1.31 |
1.3077611940299 |
$764,666 |
764665.60146085 |
|
 Kelly Stinnett
 |
Stinnett Kelly |
C |
$1,000,000 |
1000000 |
1.27% |
1.27 |
0.82 |
0.823699 |
0.82 |
0.823699 |
$1,214,036 |
1214035.7096464 |
|
 Byung-Hyun Kim
 |
Kim Byung-Hyun |
RP |
$762,500 |
762500 |
0.97% |
0.97 |
2.49 |
2.49453 |
3.27 |
3.2715147540984 |
$305,669 |
305668.80334171 |
|
 Andy Fox
 |
Fox Andy |
3B |
$750,000 |
750000 |
0.95% |
0.95 |
-0.61 |
-0.606866 |
— |
0 |
— |
0 |
|
 Travis Lee
 |
Lee Travis |
RF |
$500,000 |
500000 |
0.63% |
0.63 |
0.37 |
0.36535 |
0.73 |
0.7307 |
$1,368,551 |
1368550.7048036 |
|
 David Dellucci
 |
Dellucci David |
PH |
$312,500 |
312500 |
0.40% |
0.40 |
-0.01 |
-0.0143033 |
— |
0 |
— |
0 |
|
 Damian Miller
 |
Miller Damian |
C |
$300,000 |
300000 |
0.38% |
0.38 |
2.74 |
2.73737 |
9.12 |
9.1245666666667 |
$109,594 |
109594.24557148 |
|
 Erubiel Durazo
 |
Durazo Erubiel |
1B |
$260,000 |
260000 |
0.33% |
0.33 |
0.58 |
0.584615 |
2.25 |
2.2485192307692 |
$444,737 |
444737.13469548 |
|
 Jon Coutlangus
 |
Coutlangus Jon |
DNP |
$200,000 |
200000 |
0.25% |
0.25 |
— |
0.00 |
— |
0 |
— |
0 |
|
| Year | Diamondbacks payroll |
PR Sort |
Avg payroll |
AvgPR Sort |
Diff |
Diff Sort |
|---|
| 1999 | $8,600,000 | 8600000 | $7,867,823 | 7867823 | $732,177 | 732177 |
| 2000 | $78,869,333 | 78869333 | $55,368,142 | 55368142 | $23,501,191 | 23501191 |
| 2001 | $85,080,499 | 85080499 | $64,937,084 | 64937084 | $20,143,415 | 20143415 |
| 2002 | $104,517,499 | 104517499 | $67,238,672 | 67238672 | $37,278,827 | 37278827 |
| 2003 | $80,557,000 | 80557000 | $70,654,480 | 70654480 | $9,902,520 | 9902520 |
| 2004 | $69,935,750 | 69935750 | $69,466,729 | 69466729 | $469,021 | 469021 |
| 2005 | $62,413,833 | 62413833 | $74,114,841 | 74114841 | $-11,701,008 | -11701008 |
| 2006 | $62,073,898 | 62073898 | $79,621,815 | 79621815 | $-17,547,917 | -17547917 |
| 2007 | $52,402,000 | 52402000 | $85,537,470 | 85537470 | $-33,135,470 | -33135470 |
| 2008 | $66,138,000 | 66138000 | $92,003,799 | 92003799 | $-25,865,799 | -25865799 |
| 2009 | $73,375,000 | 73375000 | $92,169,598 | 92169598 | $-18,794,598 | -18794598 |
| 2010 | $71,984,833 | 71984833 | $94,342,601 | 94342601 | $-22,357,768 | -22357768 |
| 2011 | $55,889,833 | 55889833 | $96,974,710 | 96974710 | $-41,084,877 | -41084877 |
| 2012 | $75,908,166 | 75908166 | $100,947,217 | 100947217 | $-25,039,051 | -25039051 |
| 2013 | $90,300,500 | 90300500 | $108,586,966 | 108586966 | $-18,286,466 | -18286466 |
| 2014 | $112,315,500 | 112315500 | $117,131,361 | 117131361 | $-4,815,861 | -4815861 |
| 2015 | $88,187,000 | 88187000 | $126,168,161 | 126168161 | $-37,981,161 | -37981161 |
| 2016 | $98,172,683 | 98172683 | $131,756,569 | 131756569 | $-33,583,886 | -33583886 |
| 2017 | $93,120,200 | 93120200 | $136,337,445 | 136337445 | $-43,217,245 | -43217245 |
| 2018 | $131,965,116 | 131965116 | $135,360,600 | 135360600 | $-3,395,484 | -3395484 |
| 2019 | $123,815,766 | 123815766 | $134,792,134 | 134792134 | $-10,976,368 | -10976368 |
| 2020 | $121,918,000 | 121918000 | $139,496,467 | 139496467 | $-17,578,467 | -17578467 |
| 2021 | $96,423,700 | 96423700 | $130,712,288 | 130712288 | $-34,288,588 | -34288588 |
| 2022 | $89,856,200 | 89856200 | $149,802,695 | 149802695 | $-59,946,495 | -59946495 |
| 2023 | $113,296,972 | 113296972 | $161,692,345 | 161692345 | $-48,395,373 | -48395373 |
| 2024 | $122,750,715 | 122750715 | $136,306,249 | 136306249 | $-13,555,534 | -13555534 |
| 2025 | $63,475,000 | 63475000 | $98,329,527 | 98329527 | $-34,854,527 | -34854527 |
| 2026 | $61,225,000 | 61225000 | $78,039,273 | 78039273 | $-16,814,273 | -16814273 |
| 2027 | $51,225,000 | 51225000 | $60,919,343 | 60919343 | $-9,694,343 | -9694343 |
| 2028 | $23,625,000 | 23625000 | $46,901,712 | 46901712 | $-23,276,712 | -23276712 |
| 2029 | $28,625,000 | 28625000 | $38,597,944 | 38597944 | $-9,972,944 | -9972944 |
| 2030 | $28,625,000 | 28625000 | $41,447,579 | 41447579 | $-12,822,579 | -12822579 |
| 2031 | $5,000,000 | 5000000 | $38,360,152 | 38360152 | $-33,360,152 | -33360152 |
|
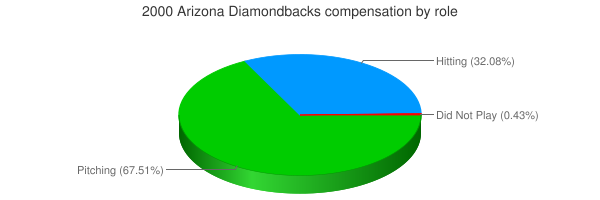
 2000 Arizona Diamondbacks