| Player | Player Sort | Pos | Salary | Salary Sort | Pct | Pct Sort | WARP | WARP Sort | WARP/$M | WARP/$M Sort | $/WARP | $/WARP Sort | Current Status |
|---|
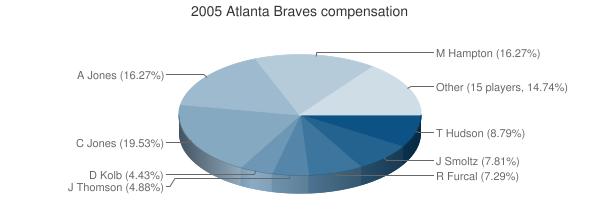
 Chipper Jones
 |
Jones Chipper |
3B |
$16,061,802 |
16061802 |
18.58% |
18.58 |
3.79 |
3.7862 |
0.24 |
0.23572697509283 |
$4,242,196 |
4242195.8692092 |
|
 Mike Hampton
 |
Hampton Mike |
RP |
$15,125,000 |
15125000 |
17.49% |
17.49 |
0.88 |
0.881466 |
0.06 |
0.058278743801653 |
$17,158,915 |
17158914.807831 |
|
 Andruw Jones
 |
Jones Andruw |
CF |
$13,000,000 |
13000000 |
15.04% |
15.04 |
5.61 |
5.61087 |
0.43 |
0.43160538461538 |
$2,316,931 |
2316931.242392 |
|
 John Smoltz
 |
Smoltz John |
RP |
$9,000,000 |
9000000 |
10.41% |
10.41 |
6.42 |
6.42237 |
0.71 |
0.71359666666667 |
$1,401,352 |
1401351.8374058 |
|
 Tim Hudson
 |
Hudson Tim |
RP |
$6,500,000 |
6500000 |
7.52% |
7.52 |
2.27 |
2.26975 |
0.35 |
0.34919230769231 |
$2,863,752 |
2863751.514484 |
|
 Rafael Furcal
 |
Furcal Rafael |
SS |
$5,600,000 |
5600000 |
6.48% |
6.48 |
6.80 |
6.79756 |
1.21 |
1.21385 |
$823,825 |
823825.01956584 |
|
 John Thomson
 |
Thomson John |
RP |
$4,250,000 |
4250000 |
4.92% |
4.92 |
1.58 |
1.58084 |
0.37 |
0.37196235294118 |
$2,688,444 |
2688444.1183168 |
|
 Dan Kolb
 |
Kolb Dan |
RP |
$3,400,000 |
3400000 |
3.93% |
3.93 |
0.20 |
0.200266 |
0.06 |
0.058901764705882 |
$16,977,420 |
16977420.031358 |
|
 Marcus Giles
 |
Giles Marcus |
2B |
$2,350,000 |
2350000 |
2.72% |
2.72 |
4.50 |
4.501 |
1.92 |
1.9153191489362 |
$522,106 |
522106.19862253 |
|
 Tom Martin
 |
Martin Tom |
RP |
$1,900,000 |
1900000 |
2.20% |
2.20 |
-0.08 |
-0.0797907 |
— |
0 |
— |
0 |
|
 Chris Reitsma
 |
Reitsma Chris |
RP |
$1,650,000 |
1650000 |
1.91% |
1.91 |
1.14 |
1.13808 |
0.69 |
0.68974545454545 |
$1,449,810 |
1449810.2066639 |
|
 Julio Franco
 |
Franco Julio |
1B |
$1,000,000 |
1000000 |
1.16% |
1.16 |
0.42 |
0.418108 |
0.42 |
0.418108 |
$2,391,727 |
2391726.5395544 |
|
 Raul Mondesi
 |
Mondesi Raul |
RF |
$1,000,000 |
1000000 |
1.16% |
1.16 |
-0.48 |
-0.475641 |
— |
0 |
— |
0 |
|
 Kevin Gryboski
 |
Gryboski Kevin |
RP |
$877,500 |
877500 |
1.01% |
1.01 |
-0.51 |
-0.513691 |
— |
0 |
— |
0 |
|
 Jorge Sosa
 |
Sosa Jorge |
RP |
$650,000 |
650000 |
0.75% |
0.75 |
-1.35 |
-1.35122 |
— |
0 |
— |
0 |
|
 Eddie Pérez
 |
Perez Eddie |
C |
$625,000 |
625000 |
0.72% |
0.72 |
-0.03 |
-0.0275223 |
— |
0 |
— |
0 |
|
 Brian Jordan
 |
Jordan Brian |
LF |
$600,000 |
600000 |
0.69% |
0.69 |
0.48 |
0.484259 |
0.81 |
0.80709833333333 |
$1,239,006 |
1239006.3994681 |
|
 Johnny Estrada
 |
Estrada Johnny |
C |
$460,000 |
460000 |
0.53% |
0.53 |
1.45 |
1.45049 |
3.15 |
3.1532391304348 |
$317,134 |
317134.20981875 |
|
 Adam Bernero
 |
Bernero Adam |
RP |
$450,000 |
450000 |
0.52% |
0.52 |
0.76 |
0.760793 |
1.69 |
1.6906511111111 |
$591,488 |
591488.09203029 |
|
 Horacio Ramirez
 |
Ramirez Horacio |
RP |
$370,000 |
370000 |
0.43% |
0.43 |
0.11 |
0.107073 |
0.29 |
0.28938648648649 |
$3,455,586 |
3455586.3756503 |
|
 Adam LaRoche
 |
LaRoche Adam |
1B |
$337,500 |
337500 |
0.39% |
0.39 |
0.44 |
0.439207 |
1.30 |
1.3013540740741 |
$768,430 |
768430.3756543 |
|
 Roman Colon
 |
Colon Roman |
RP |
$318,500 |
318500 |
0.37% |
0.37 |
0.64 |
0.639807 |
2.01 |
2.0088131868132 |
$497,806 |
497806.36973337 |
|
 Wilson Betemit
 |
Betemit Wilson |
3B |
$316,000 |
316000 |
0.37% |
0.37 |
1.10 |
1.09808 |
3.47 |
3.4749367088608 |
$287,775 |
287775.02549905 |
|
 Ryan Langerhans
 |
Langerhans Ryan |
LF |
$316,000 |
316000 |
0.37% |
0.37 |
1.49 |
1.48689 |
4.71 |
4.7053481012658 |
$212,524 |
212524.12754138 |
|
 Pete Orr
 |
Orr Pete |
PH |
$300,000 |
300000 |
0.35% |
0.35 |
0.78 |
0.7754 |
2.58 |
2.5846666666667 |
$386,897 |
386897.08537529 |
|
| Year | Braves payroll |
PR Sort |
Avg payroll |
AvgPR Sort |
Diff |
Diff Sort |
|---|
| 1988 | $62,500 | 62500 | $732,083 | 732083 | $-669,583 | -669583 |
| 1989 | $86,000 | 86000 | $862,714 | 862714 | $-776,714 | -776714 |
| 1990 | $210,000 | 210000 | $1,203,571 | 1203571 | $-993,571 | -993571 |
| 1991 | $355,000 | 355000 | $1,884,642 | 1884642 | $-1,529,642 | -1529642 |
| 1992 | $1,525,000 | 1525000 | $2,356,071 | 2356071 | $-831,071 | -831071 |
| 1993 | $2,500,000 | 2500000 | $3,410,000 | 3410000 | $-910,000 | -910000 |
| 1994 | $3,250,000 | 3250000 | $3,911,904 | 3911904 | $-661,904 | -661904 |
| 1995 | $4,750,000 | 4750000 | $5,208,333 | 5208333 | $-458,333 | -458333 |
| 1996 | $5,609,000 | 5609000 | $4,583,416 | 4583416 | $1,025,584 | 1025584 |
| 1997 | $7,000,000 | 7000000 | $4,892,222 | 4892222 | $2,107,778 | 2107778 |
| 1998 | $7,750,000 | 7750000 | $6,661,904 | 6661904 | $1,088,096 | 1088096 |
| 1999 | $7,750,000 | 7750000 | $7,867,823 | 7867823 | $-117,823 | -117823 |
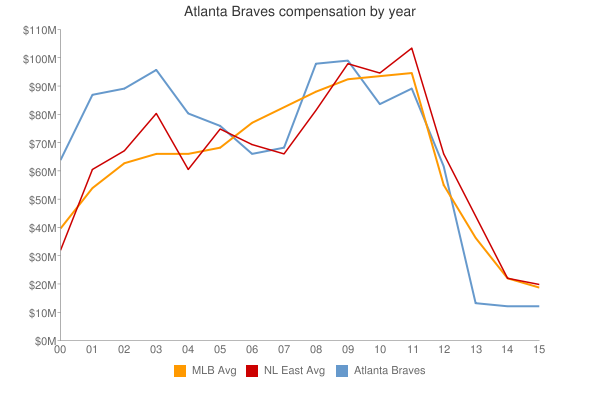
| 2000 | $82,372,500 | 82372500 | $56,164,089 | 56164089 | $26,208,411 | 26208411 |
| 2001 | $90,994,166 | 90994166 | $65,991,638 | 65991638 | $25,002,528 | 25002528 |
| 2002 | $92,460,367 | 92460367 | $68,244,471 | 68244471 | $24,215,896 | 24215896 |
| 2003 | $104,859,000 | 104859000 | $71,318,479 | 71318479 | $33,540,521 | 33540521 |
| 2004 | $90,107,500 | 90107500 | $70,466,961 | 70466961 | $19,640,539 | 19640539 |
| 2005 | $86,457,302 | 86457302 | $73,264,780 | 73264780 | $13,192,522 | 13192522 |
| 2006 | $89,820,876 | 89820876 | $79,051,754 | 79051754 | $10,769,122 | 10769122 |
| 2007 | $87,780,833 | 87780833 | $83,931,138 | 83931138 | $3,849,695 | 3849695 |
| 2008 | $103,069,017 | 103069017 | $90,812,373 | 90812373 | $12,256,644 | 12256644 |
| 2009 | $97,439,334 | 97439334 | $91,093,211 | 91093211 | $6,346,123 | 6346123 |
| 2010 | $84,390,334 | 84390334 | $93,373,681 | 93373681 | $-8,983,347 | -8983347 |
| 2011 | $92,202,417 | 92202417 | $96,102,034 | 96102034 | $-3,899,617 | -3899617 |
| 2012 | $93,529,667 | 93529667 | $100,657,138 | 100657138 | $-7,127,471 | -7127471 |
| 2013 | $90,039,583 | 90039583 | $109,024,990 | 109024990 | $-18,985,407 | -18985407 |
| 2014 | $112,865,874 | 112865874 | $117,828,782 | 117828782 | $-4,962,908 | -4962908 |
| 2015 | $97,443,604 | 97443604 | $127,404,244 | 127404244 | $-29,960,640 | -29960640 |
| 2016 | $86,580,792 | 86580792 | $132,219,407 | 132219407 | $-45,638,615 | -45638615 |
| 2017 | $122,603,054 | 122603054 | $137,302,894 | 137302894 | $-14,699,840 | -14699840 |
| 2018 | $118,284,851 | 118284851 | $136,929,168 | 136929168 | $-18,644,317 | -18644317 |
| 2019 | $128,247,089 | 128247089 | $136,944,257 | 136944257 | $-8,697,168 | -8697168 |
| 2020 | $149,673,875 | 149673875 | $140,677,788 | 140677788 | $8,996,087 | 8996087 |
| 2021 | $131,158,375 | 131158375 | $132,162,631 | 132162631 | $-1,004,256 | -1004256 |
| 2022 | $176,255,000 | 176255000 | $149,374,046 | 149374046 | $26,880,954 | 26880954 |
| 2023 | $202,857,500 | 202857500 | $160,460,390 | 160460390 | $42,397,110 | 42397110 |
| 2024 | $226,815,000 | 226815000 | $135,504,022 | 135504022 | $91,310,978 | 91310978 |
| 2025 | $144,750,000 | 144750000 | $96,417,302 | 96417302 | $48,332,698 | 48332698 |
| 2026 | $104,750,000 | 104750000 | $76,694,120 | 76694120 | $28,055,880 | 28055880 |
| 2027 | $85,000,000 | 85000000 | $58,935,617 | 58935617 | $26,064,383 | 26064383 |
| 2028 | $76,000,000 | 76000000 | $45,437,759 | 45437759 | $30,562,241 | 30562241 |
| 2029 | $59,000,000 | 59000000 | $37,269,628 | 37269628 | $21,730,372 | 21730372 |
| 2030 | $34,000,000 | 34000000 | $39,665,769 | 39665769 | $-5,665,769 | -5665769 |
| 2031 | $27,000,000 | 27000000 | $38,360,152 | 38360152 | $-11,360,152 | -11360152 |
| 2032 | $22,000,000 | 22000000 | $47,925,459 | 47925459 | $-25,925,459 | -25925459 |
|
 2005 Atlanta Braves