| Player | Player Sort | Pos | Salary | Salary Sort | Pct | Pct Sort | WARP | WARP Sort | WARP/$M | WARP/$M Sort | $/WARP | $/WARP Sort | Current Status |
|---|
 Ivan Rodriguez
 |
Rodriguez Ivan |
C |
$11,000,000 |
11000000 |
16.21% |
16.21 |
2.89 |
2.89472 |
0.26 |
0.26315636363636 |
$3,800,022 |
3800022.1092195 |
|
 Bobby Higginson
 |
Higginson Bobby |
RF |
$8,850,000 |
8850000 |
13.04% |
13.04 |
-0.56 |
-0.562743 |
— |
0 |
— |
0 |
|
 Dmitri Young
 |
Young Dmitri |
DH |
$8,000,000 |
8000000 |
11.79% |
11.79 |
1.11 |
1.11196 |
0.14 |
0.138995 |
$7,194,503 |
7194503.3994029 |
|
 Magglio Ordonez
 |
Ordonez Magglio |
RF |
$6,000,000 |
6000000 |
8.84% |
8.84 |
0.37 |
0.37148 |
0.06 |
0.061913333333333 |
$16,151,610 |
16151609.777108 |
|
 Troy Percival
 |
Percival Troy |
RP |
$6,000,000 |
6000000 |
8.84% |
8.84 |
0.14 |
0.143412 |
0.02 |
0.023902 |
$41,837,503 |
41837503.137813 |
|
 Ugueth Urbina
 |
Urbina Ugueth |
RP |
$4,000,000 |
4000000 |
5.89% |
5.89 |
0.70 |
0.698885 |
0.17 |
0.17472125 |
$5,723,402 |
5723402.2764833 |
|
 Carlos Guillen
 |
Guillen Carlos |
SS |
$4,000,000 |
4000000 |
5.89% |
5.89 |
2.73 |
2.73194 |
0.68 |
0.682985 |
$1,464,161 |
1464160.9991435 |
|
 Jason Johnson
 |
Johnson Jason |
RP |
$4,000,000 |
4000000 |
5.89% |
5.89 |
2.43 |
2.43014 |
0.61 |
0.607535 |
$1,645,996 |
1645995.7039512 |
|
 Rondell White
 |
White Rondell |
LF |
$3,250,000 |
3250000 |
4.79% |
4.79 |
1.75 |
1.75444 |
0.54 |
0.53982769230769 |
$1,852,443 |
1852442.9447573 |
|
 Carlos Pena
 |
Pena Carlos |
1B |
$2,575,000 |
2575000 |
3.79% |
3.79 |
1.00 |
1.00007 |
0.39 |
0.38837669902913 |
$2,574,820 |
2574819.7626166 |
|
 Kyle Farnsworth
 |
Farnsworth Kyle |
RP |
$1,975,000 |
1975000 |
2.91% |
2.91 |
1.63 |
1.63234 |
0.83 |
0.82650126582278 |
$1,209,920 |
1209919.5020645 |
|
 Brandon Inge
 |
Inge Brandon |
3B |
$1,350,000 |
1350000 |
1.99% |
1.99 |
3.26 |
3.25944 |
2.41 |
2.4144 |
$414,182 |
414181.57720345 |
|
 Ramon Martinez
 |
Martinez Ramon |
SS |
$1,025,000 |
1025000 |
1.51% |
1.51 |
-0.07 |
-0.0742611 |
— |
0 |
— |
0 |
|
 Jamie Walker
 |
Walker Jamie |
RP |
$900,000 |
900000 |
1.33% |
1.33 |
0.51 |
0.507331 |
0.56 |
0.56370111111111 |
$1,773,990 |
1773989.762108 |
|
 Vance Wilson
 |
Wilson Vance |
C |
$760,000 |
760000 |
1.12% |
1.12 |
-0.06 |
-0.05543 |
— |
0 |
— |
0 |
|
 Mike Maroth
 |
Maroth Mike |
RP |
$405,000 |
405000 |
0.60% |
0.60 |
1.32 |
1.32121 |
3.26 |
3.2622469135802 |
$306,537 |
306537.18939457 |
|
 Jeremy Bonderman
 |
Bonderman Jeremy |
RP |
$400,000 |
400000 |
0.59% |
0.59 |
3.16 |
3.16279 |
7.91 |
7.906975 |
$126,471 |
126470.61613322 |
|
 Craig Monroe
 |
Monroe Craig |
RF |
$400,000 |
400000 |
0.59% |
0.59 |
1.35 |
1.35196 |
3.38 |
3.3799 |
$295,867 |
295866.74161957 |
|
 Nate Robertson
 |
Robertson Nate |
RP |
$355,000 |
355000 |
0.52% |
0.52 |
1.85 |
1.85427 |
5.22 |
5.2232957746479 |
$191,450 |
191450.00458401 |
|
 Omar Infante
 |
Infante Omar |
2B |
$355,000 |
355000 |
0.52% |
0.52 |
-0.66 |
-0.660763 |
— |
0 |
— |
0 |
|
 Wilfredo Ledezma
 |
Ledezma Wilfredo |
RP |
$335,000 |
335000 |
0.49% |
0.49 |
-0.34 |
-0.34162 |
— |
0 |
— |
0 |
|
 Matt Ginter
 |
Ginter Matt |
RP |
$333,000 |
333000 |
0.49% |
0.49 |
-0.17 |
-0.166968 |
— |
0 |
— |
0 |
|
 Jason Smith
 |
Smith Jason |
SS |
$325,000 |
325000 |
0.48% |
0.48 |
-0.18 |
-0.180121 |
— |
0 |
— |
0 |
|
 Franklyn German
 |
German Franklyn |
RP |
$321,000 |
321000 |
0.47% |
0.47 |
-0.96 |
-0.957661 |
— |
0 |
— |
0 |
|
 Nook Logan
 |
Logan Nook |
CF |
$320,000 |
320000 |
0.47% |
0.47 |
0.57 |
0.573844 |
1.79 |
1.7932625 |
$557,643 |
557642.84369968 |
|
 Fernando Rodney
 |
Rodney Fernando |
RP |
$318,500 |
318500 |
0.47% |
0.47 |
0.76 |
0.756453 |
2.38 |
2.3750486656201 |
$421,044 |
421044.00405577 |
|
 Francisco Cruceta
 |
Cruceta Francisco |
DNP |
$316,000 |
316000 |
0.47% |
0.47 |
— |
0.00 |
— |
0 |
— |
0 |
|
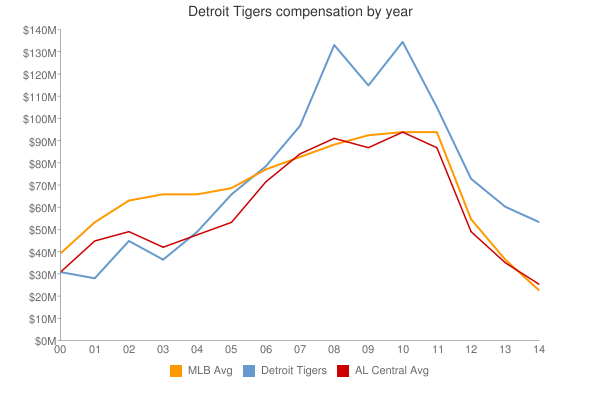
| Year | Tigers payroll |
PR Sort |
Avg payroll |
AvgPR Sort |
Diff |
Diff Sort |
|---|
| 2000 | $60,225,167 | 60225167 | $56,164,089 | 56164089 | $4,061,078 | 4061078 |
| 2001 | $48,524,167 | 48524167 | $65,991,638 | 65991638 | $-17,467,471 | -17467471 |
| 2002 | $54,640,500 | 54640500 | $68,244,471 | 68244471 | $-13,603,971 | -13603971 |
| 2003 | $55,968,000 | 55968000 | $71,318,479 | 71318479 | $-15,350,479 | -15350479 |
| 2004 | $61,141,000 | 61141000 | $70,466,961 | 70466961 | $-9,325,961 | -9325961 |
| 2005 | $67,868,500 | 67868500 | $73,264,780 | 73264780 | $-5,396,280 | -5396280 |
| 2006 | $85,198,456 | 85198456 | $79,051,754 | 79051754 | $6,146,702 | 6146702 |
| 2007 | $97,708,500 | 97708500 | $83,931,138 | 83931138 | $13,777,362 | 13777362 |
| 2008 | $138,175,833 | 138175833 | $90,812,373 | 90812373 | $47,363,460 | 47363460 |
| 2009 | $116,053,000 | 116053000 | $91,093,211 | 91093211 | $24,959,789 | 24959789 |
| 2010 | $134,062,066 | 134062066 | $93,373,681 | 93373681 | $40,688,385 | 40688385 |
| 2011 | $107,019,667 | 107019667 | $96,102,034 | 96102034 | $10,917,633 | 10917633 |
| 2012 | $133,060,667 | 133060667 | $100,657,138 | 100657138 | $32,403,529 | 32403529 |
| 2013 | $148,314,500 | 148314500 | $109,024,990 | 109024990 | $39,289,510 | 39289510 |
| 2014 | $163,635,500 | 163635500 | $117,828,782 | 117828782 | $45,806,718 | 45806718 |
| 2015 | $172,792,250 | 172792250 | $127,404,244 | 127404244 | $45,388,006 | 45388006 |
| 2016 | $198,593,000 | 198593000 | $132,219,407 | 132219407 | $66,373,593 | 66373593 |
| 2017 | $199,750,600 | 199750600 | $137,302,894 | 137302894 | $62,447,706 | 62447706 |
| 2018 | $125,286,000 | 125286000 | $136,929,168 | 136929168 | $-11,643,168 | -11643168 |
| 2019 | $115,673,500 | 115673500 | $136,944,257 | 136944257 | $-21,270,757 | -21270757 |
| 2020 | $103,966,600 | 103966600 | $140,677,788 | 140677788 | $-36,711,188 | -36711188 |
| 2021 | $82,366,200 | 82366200 | $132,162,631 | 132162631 | $-49,796,431 | -49796431 |
| 2022 | $129,413,500 | 129413500 | $149,374,046 | 149374046 | $-19,960,546 | -19960546 |
| 2023 | $122,236,500 | 122236500 | $160,460,390 | 160460390 | $-38,223,890 | -38223890 |
| 2024 | $95,073,933 | 95073933 | $135,504,022 | 135504022 | $-40,430,089 | -40430089 |
| 2025 | $39,593,333 | 39593333 | $96,417,302 | 96417302 | $-56,823,969 | -56823969 |
| 2026 | $28,333,333 | 28333333 | $76,694,120 | 76694120 | $-48,360,787 | -48360787 |
| 2027 | $28,333,333 | 28333333 | $58,935,617 | 58935617 | $-30,602,284 | -30602284 |
| 2028 | $5,333,333 | 5333333 | $45,437,759 | 45437759 | $-40,104,426 | -40104426 |
| 2029 | $5,333,333 | 5333333 | $37,269,628 | 37269628 | $-31,936,295 | -31936295 |
| 2030 | $2,642,500 | 2642500 | $39,665,769 | 39665769 | $-37,023,269 | -37023269 |
|
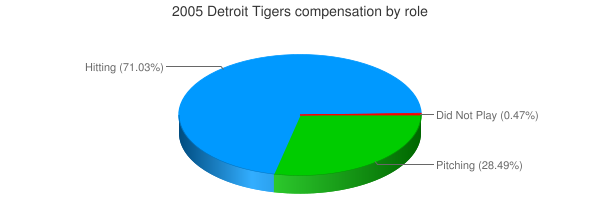
 2005 Detroit Tigers