| Player | Player Sort | Pos | Salary | Salary Sort | Pct | Pct Sort | WARP | WARP Sort | WARP/$M | WARP/$M Sort | $/WARP | $/WARP Sort | Current Status |
|---|
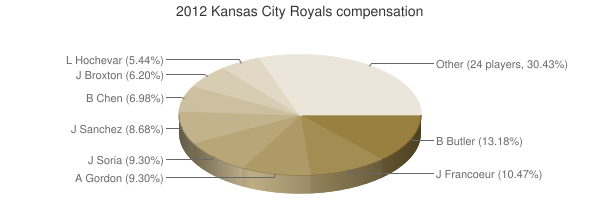
 Billy Butler
 |
Butler Billy |
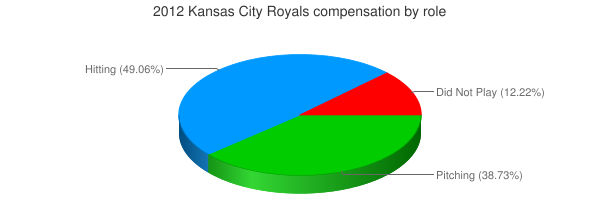
DH |
$8,500,000 |
8500000 |
13.18% |
13.18 |
3.22 |
3.21726 |
0.38 |
0.37850117647059 |
$2,642,000 |
2641999.7140424 |
|
 Jeff Francoeur
 |
Francoeur Jeff |
RF |
$6,750,000 |
6750000 |
10.47% |
10.47 |
-1.37 |
-1.36841 |
— |
0 |
— |
0 |
|
 Alex Gordon
 |
Gordon Alex |
LF |
$6,000,000 |
6000000 |
9.30% |
9.30 |
5.53 |
5.53297 |
0.92 |
0.92216166666667 |
$1,084,409 |
1084408.5545376 |
|
 Joakim Soria
 |
Soria Joakim |
DNP |
$6,000,000 |
6000000 |
9.30% |
9.30 |
— |
0.00 |
— |
0 |
— |
0 |
|
 Jonathan Sánchez
 |
Sanchez Jonathan |
RP |
$5,600,000 |
5600000 |
8.68% |
8.68 |
-2.10 |
-2.10209 |
— |
0 |
— |
0 |
|
 Bruce Chen
 |
Chen Bruce |
RP |
$4,500,000 |
4500000 |
6.98% |
6.98 |
-1.31 |
-1.31486 |
— |
0 |
— |
0 |
|
 Jonathan Broxton
 |
Broxton Jonathan |
RP |
$4,000,000 |
4000000 |
6.20% |
6.20 |
-0.08 |
-0.0843285 |
— |
0 |
— |
0 |
|
 Luke Hochevar
 |
Hochevar Luke |
RP |
$3,510,000 |
3510000 |
5.44% |
5.44 |
-0.76 |
-0.757495 |
— |
0 |
— |
0 |
|
 Yuniesky Betancourt
 |
Betancourt Yuniesky |
2B |
$2,000,000 |
2000000 |
3.10% |
3.10 |
-1.08 |
-1.08273 |
— |
0 |
— |
0 |
|
 Felipe Paulino
 |
Paulino Felipe |
RP |
$1,900,000 |
1900000 |
2.95% |
2.95 |
0.05 |
0.0520435 |
0.03 |
0.027391315789474 |
$36,507,921 |
36507921.258178 |
|
 Aaron Crow
 |
Crow Aaron |
RP |
$1,600,000 |
1600000 |
2.48% |
2.48 |
1.18 |
1.17564 |
0.73 |
0.734775 |
$1,360,961 |
1360960.8383519 |
|
 Noel Arguelles
 |
Arguelles Noel |
DNP |
$1,380,000 |
1380000 |
2.14% |
2.14 |
— |
0.00 |
— |
0 |
— |
0 |
|
 Humberto Quintero
 |
Quintero Humberto |
C |
$1,000,000 |
1000000 |
1.55% |
1.55 |
-0.40 |
-0.398848 |
— |
0 |
— |
0 |
|
 Alcides Escobar
 |
Escobar Alcides |
SS |
$1,000,000 |
1000000 |
1.55% |
1.55 |
1.47 |
1.47444 |
1.47 |
1.47444 |
$678,224 |
678223.59675538 |
|
 Chris Getz
 |
Getz Chris |
2B |
$967,500 |
967500 |
1.50% |
1.50 |
0.10 |
0.104444 |
0.11 |
0.10795245478036 |
$9,263,337 |
9263337.290797 |
|
 Jose Mijares
 |
Mijares Jose |
RP |
$925,000 |
925000 |
1.43% |
1.43 |
-0.27 |
-0.271679 |
— |
0 |
— |
0 |
|
 Brayan Peña
 |
Pena Brayan |
C |
$875,000 |
875000 |
1.36% |
1.36 |
-0.56 |
-0.555966 |
— |
0 |
— |
0 |
|
 Mitch Maier
 |
Maier Mitch |
CF |
$865,000 |
865000 |
1.34% |
1.34 |
-0.26 |
-0.257477 |
— |
0 |
— |
0 |
|
 Salvador Perez
 |
Perez Salvador |
C |
$750,000 |
750000 |
1.16% |
1.16 |
0.35 |
0.348744 |
0.46 |
0.464992 |
$2,150,575 |
2150574.6335421 |
|
 Eric Hosmer
 |
Hosmer Eric |
1B |
$502,500 |
502500 |
0.78% |
0.78 |
0.36 |
0.363721 |
0.72 |
0.72382288557214 |
$1,381,553 |
1381553.443436 |
|
 Blake Wood
 |
Wood Blake |
DNP |
$502,000 |
502000 |
0.78% |
0.78 |
— |
0.00 |
— |
0 |
— |
0 |
|
 Greg Holland
 |
Holland Greg |
RP |
$497,150 |
497150 |
0.77% |
0.77 |
1.58 |
1.58111 |
3.18 |
3.180347983506 |
$314,431 |
314431.00100562 |
|
 Tim Collins
 |
Collins Tim |
RP |
$495,725 |
495725 |
0.77% |
0.77 |
1.84 |
1.84364 |
3.72 |
3.7190781179081 |
$268,884 |
268883.83849342 |
|
 Luis Mendoza
 |
Mendoza Luis |
RP |
$488,925 |
488925 |
0.76% |
0.76 |
-0.80 |
-0.796059 |
— |
0 |
— |
0 |
|
 Jason Bourgeois
 |
Bourgeois Jason |
CF |
$488,000 |
488000 |
0.76% |
0.76 |
0.28 |
0.284999 |
0.58 |
0.5840143442623 |
$1,712,287 |
1712286.7097779 |
|
 Everett Teaford
 |
Teaford Everett |
RP |
$488,000 |
488000 |
0.76% |
0.76 |
-0.18 |
-0.178641 |
— |
0 |
— |
0 |
|
 Danny Duffy
 |
Duffy Danny |
RP |
$487,750 |
487750 |
0.76% |
0.76 |
-0.25 |
-0.25079 |
— |
0 |
— |
0 |
|
 Mike Moustakas
 |
Moustakas Mike |
3B |
$487,250 |
487250 |
0.76% |
0.76 |
3.46 |
3.46497 |
7.11 |
7.1112775782453 |
$140,622 |
140621.70812446 |
|
 Jarrod Dyson
 |
Dyson Jarrod |
CF |
$483,625 |
483625 |
0.75% |
0.75 |
2.55 |
2.54961 |
5.27 |
5.2718738692169 |
$189,686 |
189685.87352575 |
|
 Lorenzo Cain
 |
Cain Lorenzo |
CF |
$480,850 |
480850 |
0.75% |
0.75 |
1.26 |
1.25502 |
2.61 |
2.6100031194759 |
$383,141 |
383141.30452104 |
|
 Kelvin Herrera
 |
Herrera Kelvin |
RP |
$480,650 |
480650 |
0.75% |
0.75 |
2.18 |
2.17658 |
4.53 |
4.5284094455425 |
$220,828 |
220828.08810152 |
|
 Manny Piña
 |
Pina Manny |
C |
$480,425 |
480425 |
0.75% |
0.75 |
-0.05 |
-0.0457368 |
— |
0 |
— |
0 |
|
| Year | Royals payroll |
PR Sort |
Avg payroll |
AvgPR Sort |
Diff |
Diff Sort |
|---|
| 1984 | $40,000 | 40000 | $260,000 | 260000 | $-220,000 | -220000 |
| 1985 | $150,000 | 150000 | $437,500 | 437500 | $-287,500 | -287500 |
| 1986 | $925,000 | 925000 | $552,000 | 552000 | $373,000 | 373000 |
| 1987 | $740,000 | 740000 | $589,500 | 589500 | $150,500 | 150500 |
| 1988 | $1,100,000 | 1100000 | $732,083 | 732083 | $367,917 | 367917 |
| 1989 | $1,250,000 | 1250000 | $862,714 | 862714 | $387,286 | 387286 |
| 1990 | $1,375,000 | 1375000 | $1,203,571 | 1203571 | $171,429 | 171429 |
| 1991 | $2,950,000 | 2950000 | $1,884,642 | 1884642 | $1,065,358 | 1065358 |
| 1997 | $175,000 | 175000 | $4,892,222 | 4892222 | $-4,717,222 | -4717222 |
| 1998 | $230,000 | 230000 | $6,661,904 | 6661904 | $-6,431,904 | -6431904 |
| 1999 | $460,000 | 460000 | $7,867,823 | 7867823 | $-7,407,823 | -7407823 |
| 2000 | $22,835,500 | 22835500 | $57,491,092 | 57491092 | $-34,655,592 | -34655592 |
| 2001 | $34,805,000 | 34805000 | $67,120,750 | 67120750 | $-32,315,750 | -32315750 |
| 2002 | $47,427,000 | 47427000 | $69,204,705 | 69204705 | $-21,777,705 | -21777705 |
| 2003 | $41,268,000 | 41268000 | $72,156,639 | 72156639 | $-30,888,639 | -30888639 |
| 2004 | $46,671,500 | 46671500 | $71,426,357 | 71426357 | $-24,754,857 | -24754857 |
| 2005 | $37,882,000 | 37882000 | $73,628,169 | 73628169 | $-35,746,169 | -35746169 |
| 2006 | $51,655,500 | 51655500 | $81,192,832 | 81192832 | $-29,537,332 | -29537332 |
| 2007 | $70,227,500 | 70227500 | $85,747,487 | 85747487 | $-15,519,987 | -15519987 |
| 2008 | $63,830,500 | 63830500 | $93,079,041 | 93079041 | $-29,248,541 | -29248541 |
| 2009 | $77,970,833 | 77970833 | $92,957,049 | 92957049 | $-14,986,216 | -14986216 |
| 2010 | $76,260,210 | 76260210 | $94,957,956 | 94957956 | $-18,697,746 | -18697746 |
| 2011 | $39,506,000 | 39506000 | $97,426,414 | 97426414 | $-57,920,414 | -57920414 |
| 2012 | $64,485,350 | 64485350 | $100,689,500 | 100689500 | $-36,204,150 | -36204150 |
| 2013 | $81,721,725 | 81721725 | $106,658,387 | 106658387 | $-24,936,662 | -24936662 |
| 2014 | $92,185,521 | 92185521 | $115,428,670 | 115428670 | $-23,243,149 | -23243149 |
| 2015 | $112,857,025 | 112857025 | $125,458,486 | 125458486 | $-12,601,461 | -12601461 |
| 2016 | $131,487,125 | 131487125 | $130,290,910 | 130290910 | $1,196,215 | 1196215 |
| 2017 | $139,555,817 | 139555817 | $136,573,000 | 136573000 | $2,982,817 | 2982817 |
| 2018 | $124,733,117 | 124733117 | $135,681,867 | 135681867 | $-10,948,750 | -10948750 |
| 2019 | $96,470,066 | 96470066 | $134,776,225 | 134776225 | $-38,306,159 | -38306159 |
| 2020 | $84,548,842 | 84548842 | $138,321,485 | 138321485 | $-53,772,643 | -53772643 |
| 2021 | $83,438,450 | 83438450 | $129,635,938 | 129635938 | $-46,197,488 | -46197488 |
| 2022 | $94,832,900 | 94832900 | $147,002,411 | 147002411 | $-52,169,511 | -52169511 |
| 2023 | $83,968,100 | 83968100 | $158,155,877 | 158155877 | $-74,187,777 | -74187777 |
| 2024 | $77,773,611 | 77773611 | $133,074,721 | 133074721 | $-55,301,110 | -55301110 |
| 2025 | $57,111,111 | 57111111 | $94,180,059 | 94180059 | $-37,068,948 | -37068948 |
| 2026 | $16,111,111 | 16111111 | $74,818,461 | 74818461 | $-58,707,350 | -58707350 |
| 2027 | $20,111,111 | 20111111 | $56,972,319 | 56972319 | $-36,861,208 | -36861208 |
| 2028 | $31,111,111 | 31111111 | $45,437,759 | 45437759 | $-14,326,648 | -14326648 |
| 2029 | $36,111,111 | 36111111 | $37,269,628 | 37269628 | $-1,158,517 | -1158517 |
| 2030 | $36,111,111 | 36111111 | $39,665,769 | 39665769 | $-3,554,658 | -3554658 |
| 2031 | $35,000,000 | 35000000 | $38,360,152 | 38360152 | $-3,360,152 | -3360152 |
| 2032 | $35,000,000 | 35000000 | $47,925,459 | 47925459 | $-12,925,459 | -12925459 |
| 2033 | $35,000,000 | 35000000 | $43,068,924 | 43068924 | $-8,068,924 | -8068924 |
| 2034 | $35,000,000 | 35000000 | $29,428,571 | 29428571 | $5,571,429 | 5571429 |
|
 2012 Kansas City Royals