| Player | Player Sort | Pos | Salary | Salary Sort | Pct | Pct Sort | WARP | WARP Sort | WARP/$M | WARP/$M Sort | $/WARP | $/WARP Sort | Current Status |
|---|
 Jeff Suppan
 |
Suppan Jeff |
RP |
$12,750,000 |
12750000 |
15.50% |
15.50 |
0.04 |
0.0365292 |
0.00 |
0.0028650352941176 |
$349,035,840 |
349035839.82129 |
|
 Prince Fielder
 |
Fielder Prince |
1B |
$11,000,000 |
11000000 |
13.37% |
13.37 |
4.21 |
4.20744 |
0.38 |
0.38249454545455 |
$2,614,416 |
2614416.3671972 |
|
 Randy Wolf
 |
Wolf Randy |
RP |
$9,250,000 |
9250000 |
11.25% |
11.25 |
0.49 |
0.491266 |
0.05 |
0.053109837837838 |
$18,828,903 |
18828903.282539 |
|
 Trevor Hoffman
 |
Hoffman Trevor |
RP |
$7,500,000 |
7500000 |
9.12% |
9.12 |
-0.54 |
-0.541613 |
— |
0 |
— |
0 |
|
 Corey Hart
 |
Hart Corey |
RF |
$4,800,000 |
4800000 |
5.84% |
5.84 |
3.13 |
3.13327 |
0.65 |
0.65276458333333 |
$1,531,946 |
1531945.8584801 |
|
 David Riske
 |
Riske David |
RP |
$4,500,000 |
4500000 |
5.47% |
5.47 |
-0.11 |
-0.107805 |
— |
0 |
— |
0 |
|
 Doug Davis
 |
Davis Doug |
RP |
$4,250,000 |
4250000 |
5.17% |
5.17 |
-0.21 |
-0.206739 |
— |
0 |
— |
0 |
|
 Dave Bush
 |
Bush Dave |
RP |
$4,215,000 |
4215000 |
5.12% |
5.12 |
-1.70 |
-1.70466 |
— |
0 |
— |
0 |
|
 LaTroy Hawkins
 |
Hawkins LaTroy |
RP |
$3,250,000 |
3250000 |
3.95% |
3.95 |
0.13 |
0.132507 |
0.04 |
0.040771384615385 |
$24,527,006 |
24527006.120431 |
|
 Rickie Weeks Jr.
 |
Weeks Jr. Rickie |
2B |
$2,750,000 |
2750000 |
3.34% |
3.34 |
5.08 |
5.08375 |
1.85 |
1.8486363636364 |
$540,939 |
540939.26727317 |
|
 Craig Counsell
 |
Counsell Craig |
PH |
$2,100,000 |
2100000 |
2.55% |
2.55 |
0.48 |
0.476093 |
0.23 |
0.22671095238095 |
$4,410,903 |
4410902.9118261 |
|
 Todd Coffey
 |
Coffey Todd |
RP |
$2,025,000 |
2025000 |
2.46% |
2.46 |
0.59 |
0.586738 |
0.29 |
0.28974716049383 |
$3,451,285 |
3451284.900586 |
|
 Jody Gerut
 |
Gerut Jody |
PH |
$2,000,000 |
2000000 |
2.43% |
2.43 |
0.17 |
0.172589 |
0.09 |
0.0862945 |
$11,588,224 |
11588224.046724 |
|
 Gregg Zaun
 |
Zaun Gregg |
C |
$1,900,000 |
1900000 |
2.31% |
2.31 |
1.60 |
1.59723 |
0.84 |
0.84064736842105 |
$1,189,559 |
1189559.4247541 |
|
 Ryan Braun
 |
Braun Ryan |
LF |
$1,287,500 |
1287500 |
1.57% |
1.57 |
5.57 |
5.57112 |
4.33 |
4.3270834951456 |
$231,103 |
231102.54311521 |
|
 Carlos Gómez
 |
Gomez Carlos |
CF |
$1,100,000 |
1100000 |
1.34% |
1.34 |
-0.36 |
-0.363055 |
— |
0 |
— |
0 |
|
 Carlos Villanueva
 |
Villanueva Carlos |
RP |
$950,000 |
950000 |
1.15% |
1.15 |
-0.32 |
-0.318314 |
— |
0 |
— |
0 |
|
 Claudio Vargas
 |
Vargas Claudio |
RP |
$900,000 |
900000 |
1.09% |
1.09 |
-0.07 |
-0.0678221 |
— |
0 |
— |
0 |
|
 Jim Edmonds
 |
Edmonds Jim |
CF |
$850,000 |
850000 |
1.03% |
1.03 |
2.58 |
2.58399 |
3.04 |
3.0399882352941 |
$328,949 |
328948.64144211 |
|
 Yovani Gallardo
 |
Gallardo Yovani |
RP |
$750,000 |
750000 |
0.91% |
0.91 |
5.61 |
5.60587 |
7.47 |
7.4744933333333 |
$133,788 |
133788.33258709 |
|
 Manny Parra
 |
Parra Manny |
RP |
$440,000 |
440000 |
0.53% |
0.53 |
1.46 |
1.46008 |
3.32 |
3.3183636363636 |
$301,353 |
301353.35050134 |
|
 Casey McGehee
 |
McGehee Casey |
3B |
$427,500 |
427500 |
0.52% |
0.52 |
3.51 |
3.51023 |
8.21 |
8.2110643274854 |
$121,787 |
121786.89145725 |
|
 Mitch Stetter
 |
Stetter Mitch |
RP |
$420,000 |
420000 |
0.51% |
0.51 |
0.07 |
0.0663138 |
0.16 |
0.15789 |
$6,333,523 |
6333523.3390335 |
|
 Joe Inglett
 |
Inglett Joe |
PH |
$416,000 |
416000 |
0.51% |
0.51 |
0.54 |
0.53827 |
1.29 |
1.2939182692308 |
$772,846 |
772846.3410556 |
|
 George Kottaras
 |
Kottaras George |
C |
$408,500 |
408500 |
0.50% |
0.50 |
1.02 |
1.01857 |
2.49 |
2.4934394124847 |
$401,052 |
401052.45589405 |
|
 Mat Gamel
 |
Gamel Mat |
PH |
$406,500 |
406500 |
0.49% |
0.49 |
-0.07 |
-0.066482 |
— |
0 |
— |
0 |
|
 Chris Narveson
 |
Narveson Chris |
RP |
$406,500 |
406500 |
0.49% |
0.49 |
3.19 |
3.19105 |
7.85 |
7.850061500615 |
$127,388 |
127387.5370176 |
|
 Alcides Escobar
 |
Escobar Alcides |
SS |
$405,500 |
405500 |
0.49% |
0.49 |
0.02 |
0.0209942 |
0.05 |
0.051773612823674 |
$19,314,858 |
19314858.38946 |
|
 David Weathers
 |
Weathers David |
DNP |
$400,000 |
400000 |
0.49% |
0.49 |
— |
0.00 |
— |
0 |
— |
0 |
|
 Josh Butler
 |
Butler Josh |
DNP |
$400,000 |
400000 |
0.49% |
0.49 |
— |
0.00 |
— |
0 |
— |
0 |
|
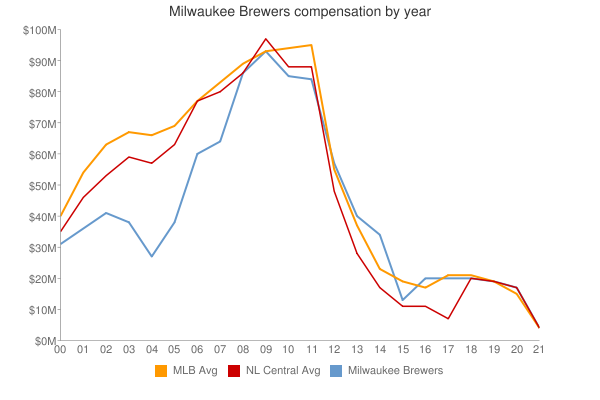
| Year | Brewers payroll |
PR Sort |
Avg payroll |
AvgPR Sort |
Diff |
Diff Sort |
|---|
| 2000 | $35,770,333 | 35770333 | $56,164,089 | 56164089 | $-20,393,756 | -20393756 |
| 2001 | $44,278,333 | 44278333 | $65,991,638 | 65991638 | $-21,713,305 | -21713305 |
| 2002 | $50,062,333 | 50062333 | $68,244,471 | 68244471 | $-18,182,138 | -18182138 |
| 2003 | $41,052,000 | 41052000 | $71,318,479 | 71318479 | $-30,266,479 | -30266479 |
| 2004 | $27,428,500 | 27428500 | $70,466,961 | 70466961 | $-43,038,461 | -43038461 |
| 2005 | $38,488,000 | 38488000 | $73,264,780 | 73264780 | $-34,776,780 | -34776780 |
| 2006 | $60,452,000 | 60452000 | $79,051,754 | 79051754 | $-18,599,754 | -18599754 |
| 2007 | $70,575,500 | 70575500 | $83,931,138 | 83931138 | $-13,355,638 | -13355638 |
| 2008 | $78,594,000 | 78594000 | $90,812,373 | 90812373 | $-12,218,373 | -12218373 |
| 2009 | $80,682,500 | 80682500 | $91,093,211 | 91093211 | $-10,410,711 | -10410711 |
| 2010 | $82,258,000 | 82258000 | $93,373,681 | 93373681 | $-11,115,681 | -11115681 |
| 2011 | $84,253,333 | 84253333 | $96,102,034 | 96102034 | $-11,848,701 | -11848701 |
| 2012 | $97,650,833 | 97650833 | $100,657,138 | 100657138 | $-3,006,305 | -3006305 |
| 2013 | $89,978,333 | 89978333 | $109,024,990 | 109024990 | $-19,046,657 | -19046657 |
| 2014 | $103,697,967 | 103697967 | $117,828,782 | 117828782 | $-14,130,815 | -14130815 |
| 2015 | $104,237,000 | 104237000 | $127,404,244 | 127404244 | $-23,167,244 | -23167244 |
| 2016 | $63,908,300 | 63908300 | $132,219,407 | 132219407 | $-68,311,107 | -68311107 |
| 2017 | $63,061,300 | 63061300 | $137,302,894 | 137302894 | $-74,241,594 | -74241594 |
| 2018 | $90,964,571 | 90964571 | $136,929,168 | 136929168 | $-45,964,597 | -45964597 |
| 2019 | $123,430,400 | 123430400 | $136,944,257 | 136944257 | $-13,513,857 | -13513857 |
| 2020 | $98,563,503 | 98563503 | $140,677,788 | 140677788 | $-42,114,285 | -42114285 |
| 2021 | $96,341,127 | 96341127 | $132,162,631 | 132162631 | $-35,821,504 | -35821504 |
| 2022 | $130,946,826 | 130946826 | $149,374,046 | 149374046 | $-18,427,220 | -18427220 |
| 2023 | $117,578,060 | 117578060 | $160,460,390 | 160460390 | $-42,882,330 | -42882330 |
| 2024 | $78,234,960 | 78234960 | $135,504,022 | 135504022 | $-57,269,062 | -57269062 |
| 2025 | $59,700,000 | 59700000 | $96,417,302 | 96417302 | $-36,717,302 | -36717302 |
| 2026 | $45,700,000 | 45700000 | $76,694,120 | 76694120 | $-30,994,120 | -30994120 |
| 2027 | $33,700,000 | 33700000 | $58,935,617 | 58935617 | $-25,235,617 | -25235617 |
| 2028 | $27,000,000 | 27000000 | $45,437,759 | 45437759 | $-18,437,759 | -18437759 |
| 2029 | $6,500,000 | 6500000 | $37,269,628 | 37269628 | $-30,769,628 | -30769628 |
|
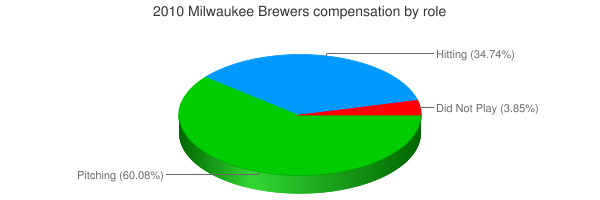
 2010 Milwaukee Brewers