| Player | Player Sort | Pos | Salary | Salary Sort | Pct | Pct Sort | WARP | WARP Sort | WARP/$M | WARP/$M Sort | $/WARP | $/WARP Sort | Current Status |
|---|
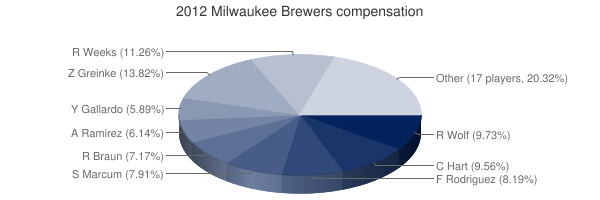
 Zack Greinke
 |
Greinke Zack |
RP |
$13,500,000 |
13500000 |
13.82% |
13.82 |
3.03 |
3.03422 |
0.22 |
0.22475703703704 |
$4,449,249 |
4449248.9008707 |
|
 Rickie Weeks Jr.
 |
Weeks Jr. Rickie |
2B |
$11,000,000 |
11000000 |
11.26% |
11.26 |
0.36 |
0.359676 |
0.03 |
0.032697818181818 |
$30,583,080 |
30583080.327851 |
|
 Randy Wolf
 |
Wolf Randy |
RP |
$9,500,000 |
9500000 |
9.73% |
9.73 |
-1.61 |
-1.60778 |
— |
0 |
— |
0 |
|
 Corey Hart
 |
Hart Corey |
1B |
$9,333,333 |
9333333 |
9.56% |
9.56 |
1.50 |
1.50096 |
0.16 |
0.16081714860061 |
$6,218,242 |
6218242.3249121 |
|
 Francisco Rodríguez
 |
Rodriguez Francisco |
RP |
$8,000,000 |
8000000 |
8.19% |
8.19 |
0.25 |
0.251041 |
0.03 |
0.031380125 |
$31,867,305 |
31867304.543879 |
|
 Shaun Marcum
 |
Marcum Shaun |
RP |
$7,725,000 |
7725000 |
7.91% |
7.91 |
1.01 |
1.01446 |
0.13 |
0.1313216828479 |
$7,614,889 |
7614888.709264 |
|
 Ryan Braun
 |
Braun Ryan |
LF |
$7,000,000 |
7000000 |
7.17% |
7.17 |
6.25 |
6.25188 |
0.89 |
0.89312571428571 |
$1,119,663 |
1119663.2053078 |
|
 Aramis Ramirez
 |
Ramirez Aramis |
3B |
$6,000,000 |
6000000 |
6.14% |
6.14 |
4.19 |
4.19389 |
0.70 |
0.69898166666667 |
$1,430,653 |
1430652.6876003 |
|
 Yovani Gallardo
 |
Gallardo Yovani |
RP |
$5,750,000 |
5750000 |
5.89% |
5.89 |
4.61 |
4.61438 |
0.80 |
0.80250086956522 |
$1,246,105 |
1246104.5687611 |
|
 Alex Gonzalez
 |
Gonzalez Alex |
SS |
$3,500,000 |
3500000 |
3.58% |
3.58 |
0.44 |
0.435173 |
0.12 |
0.12433514285714 |
$8,042,778 |
8042778.3892843 |
|
 Nyjer Morgan
 |
Morgan Nyjer |
CF |
$2,350,000 |
2350000 |
2.41% |
2.41 |
-0.83 |
-0.825065 |
— |
0 |
— |
0 |
|
 Kameron Loe
 |
Loe Kameron |
RP |
$2,175,000 |
2175000 |
2.23% |
2.23 |
-0.05 |
-0.0463998 |
— |
0 |
— |
0 |
|
 Jose Veras
 |
Veras Jose |
RP |
$2,000,000 |
2000000 |
2.05% |
2.05 |
0.92 |
0.924834 |
0.46 |
0.462417 |
$2,162,550 |
2162550.2522615 |
|
 Carlos Gómez
 |
Gomez Carlos |
CF |
$1,962,500 |
1962500 |
2.01% |
2.01 |
2.44 |
2.44206 |
1.24 |
1.2443617834395 |
$803,625 |
803624.80856326 |
|
 Manny Parra
 |
Parra Manny |
RP |
$1,200,000 |
1200000 |
1.23% |
1.23 |
-0.24 |
-0.235372 |
— |
0 |
— |
0 |
|
 Norichika Aoki
 |
Aoki Norichika |
RF |
$1,000,000 |
1000000 |
1.02% |
1.02 |
3.07 |
3.07158 |
3.07 |
3.07158 |
$325,565 |
325565.34422024 |
|
 Cesar Izturis
 |
Izturis Cesar |
SS |
$875,000 |
875000 |
0.90% |
0.90 |
-0.35 |
-0.3512 |
— |
0 |
— |
0 |
|
 George Kottaras
 |
Kottaras George |
PH |
$700,000 |
700000 |
0.72% |
0.72 |
0.60 |
0.602448 |
0.86 |
0.86064 |
$1,161,926 |
1161926.0085518 |
|
 Jonathan Lucroy
 |
Lucroy Jonathan |
C |
$600,000 |
600000 |
0.61% |
0.61 |
5.51 |
5.5116 |
9.19 |
9.186 |
$108,861 |
108861.31069018 |
|
 John Axford
 |
Axford John |
RP |
$525,000 |
525000 |
0.54% |
0.54 |
0.20 |
0.195022 |
0.37 |
0.37147047619048 |
$2,692,004 |
2692003.9790383 |
|
 Travis Ishikawa
 |
Ishikawa Travis |
PH |
$525,000 |
525000 |
0.54% |
0.54 |
-0.10 |
-0.10349 |
— |
0 |
— |
0 |
|
 Chris Narveson
 |
Narveson Chris |
RP |
$500,000 |
500000 |
0.51% |
0.51 |
0.05 |
0.0491174 |
0.10 |
0.0982348 |
$10,179,692 |
10179691.921804 |
|
 Marco Estrada
 |
Estrada Marco |
RP |
$486,000 |
486000 |
0.50% |
0.50 |
3.09 |
3.0938 |
6.37 |
6.3658436213992 |
$157,088 |
157088.37028897 |
|
 Tim Dillard
 |
Dillard Tim |
RP |
$482,000 |
482000 |
0.49% |
0.49 |
-0.51 |
-0.510676 |
— |
0 |
— |
0 |
|
 Brandon Kintzler
 |
Kintzler Brandon |
RP |
$481,000 |
481000 |
0.49% |
0.49 |
0.05 |
0.0474702 |
0.10 |
0.098690644490644 |
$10,132,673 |
10132672.708352 |
|
 Mat Gamel
 |
Gamel Mat |
1B |
$481,000 |
481000 |
0.49% |
0.49 |
-0.24 |
-0.244785 |
— |
0 |
— |
0 |
|
| Year | Brewers payroll |
PR Sort |
Avg payroll |
AvgPR Sort |
Diff |
Diff Sort |
|---|
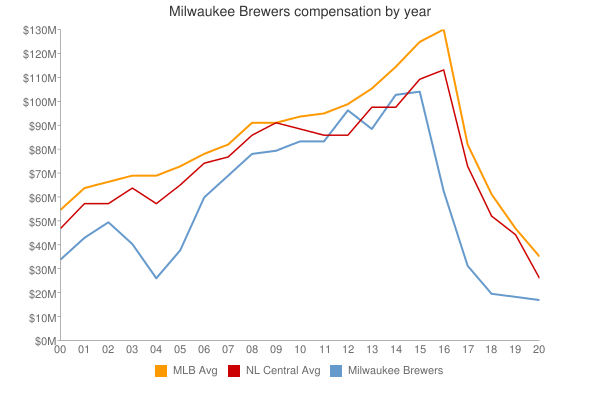
| 2000 | $35,770,333 | 35770333 | $57,491,092 | 57491092 | $-21,720,759 | -21720759 |
| 2001 | $44,278,333 | 44278333 | $67,120,750 | 67120750 | $-22,842,417 | -22842417 |
| 2002 | $50,062,333 | 50062333 | $69,204,705 | 69204705 | $-19,142,372 | -19142372 |
| 2003 | $41,052,000 | 41052000 | $72,156,639 | 72156639 | $-31,104,639 | -31104639 |
| 2004 | $27,428,500 | 27428500 | $71,426,357 | 71426357 | $-43,997,857 | -43997857 |
| 2005 | $38,488,000 | 38488000 | $73,628,169 | 73628169 | $-35,140,169 | -35140169 |
| 2006 | $60,452,000 | 60452000 | $81,192,832 | 81192832 | $-20,740,832 | -20740832 |
| 2007 | $70,575,500 | 70575500 | $85,747,487 | 85747487 | $-15,171,987 | -15171987 |
| 2008 | $78,594,000 | 78594000 | $93,079,041 | 93079041 | $-14,485,041 | -14485041 |
| 2009 | $80,682,500 | 80682500 | $92,957,049 | 92957049 | $-12,274,549 | -12274549 |
| 2010 | $82,258,000 | 82258000 | $94,957,956 | 94957956 | $-12,699,956 | -12699956 |
| 2011 | $84,253,333 | 84253333 | $97,426,414 | 97426414 | $-13,173,081 | -13173081 |
| 2012 | $97,650,833 | 97650833 | $100,689,500 | 100689500 | $-3,038,667 | -3038667 |
| 2013 | $89,978,333 | 89978333 | $106,658,387 | 106658387 | $-16,680,054 | -16680054 |
| 2014 | $103,697,967 | 103697967 | $115,428,670 | 115428670 | $-11,730,703 | -11730703 |
| 2015 | $104,237,000 | 104237000 | $125,458,486 | 125458486 | $-21,221,486 | -21221486 |
| 2016 | $63,908,300 | 63908300 | $130,290,910 | 130290910 | $-66,382,610 | -66382610 |
| 2017 | $63,061,300 | 63061300 | $136,573,000 | 136573000 | $-73,511,700 | -73511700 |
| 2018 | $90,964,571 | 90964571 | $135,681,867 | 135681867 | $-44,717,296 | -44717296 |
| 2019 | $123,430,400 | 123430400 | $134,776,225 | 134776225 | $-11,345,825 | -11345825 |
| 2020 | $98,563,503 | 98563503 | $138,321,485 | 138321485 | $-39,757,982 | -39757982 |
| 2021 | $96,341,127 | 96341127 | $129,635,938 | 129635938 | $-33,294,811 | -33294811 |
| 2022 | $130,946,826 | 130946826 | $147,002,411 | 147002411 | $-16,055,585 | -16055585 |
| 2023 | $117,578,060 | 117578060 | $158,155,877 | 158155877 | $-40,577,817 | -40577817 |
| 2024 | $78,234,960 | 78234960 | $133,074,721 | 133074721 | $-54,839,761 | -54839761 |
| 2025 | $59,700,000 | 59700000 | $94,180,059 | 94180059 | $-34,480,059 | -34480059 |
| 2026 | $45,700,000 | 45700000 | $74,818,461 | 74818461 | $-29,118,461 | -29118461 |
| 2027 | $33,700,000 | 33700000 | $56,972,319 | 56972319 | $-23,272,319 | -23272319 |
| 2028 | $27,000,000 | 27000000 | $45,437,759 | 45437759 | $-18,437,759 | -18437759 |
| 2029 | $6,500,000 | 6500000 | $37,269,628 | 37269628 | $-30,769,628 | -30769628 |
|
 2012 Milwaukee Brewers