| Player | Player Sort | Pos | Salary | Salary Sort | Pct | Pct Sort | WARP | WARP Sort | WARP/$M | WARP/$M Sort | $/WARP | $/WARP Sort | Current Status |
|---|
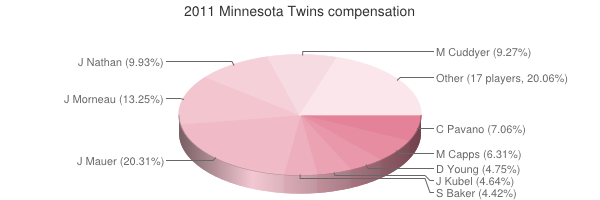
 Joe Mauer
 |
Mauer Joe |
C |
$23,000,000 |
23000000 |
20.31% |
20.31 |
1.72 |
1.71517 |
0.07 |
0.074572608695652 |
$13,409,749 |
13409749.470898 |
|
 Justin Morneau
 |
Morneau Justin |
1B |
$15,000,000 |
15000000 |
13.25% |
13.25 |
-1.82 |
-1.81617 |
— |
0 |
— |
0 |
|
 Joe Nathan
 |
Nathan Joe |
RP |
$11,250,000 |
11250000 |
9.93% |
9.93 |
0.66 |
0.655063 |
0.06 |
0.058227822222222 |
$17,173,921 |
17173920.676332 |
|
 Michael Cuddyer
 |
Cuddyer Michael |
RF |
$10,500,000 |
10500000 |
9.27% |
9.27 |
2.55 |
2.55251 |
0.24 |
0.24309619047619 |
$4,113,598 |
4113597.9878629 |
|
 Carl Pavano
 |
Pavano Carl |
RP |
$8,000,000 |
8000000 |
7.06% |
7.06 |
0.93 |
0.928888 |
0.12 |
0.116111 |
$8,612,448 |
8612448.432965 |
|
 Matt Capps
 |
Capps Matt |
RP |
$7,150,000 |
7150000 |
6.31% |
6.31 |
-0.51 |
-0.510954 |
— |
0 |
— |
0 |
|
 Delmon Young
 |
Young Delmon |
LF |
$5,375,000 |
5375000 |
4.75% |
4.75 |
-0.41 |
-0.409026 |
— |
0 |
— |
0 |
|
 Jason Kubel
 |
Kubel Jason |
RF |
$5,250,000 |
5250000 |
4.64% |
4.64 |
1.03 |
1.02852 |
0.20 |
0.19590857142857 |
$5,104,422 |
5104421.8877611 |
|
 Scott Baker
 |
Baker Scott |
RP |
$5,000,000 |
5000000 |
4.42% |
4.42 |
1.79 |
1.78988 |
0.36 |
0.357976 |
$2,793,483 |
2793483.3620131 |
|
 Francisco Liriano
 |
Liriano Francisco |
RP |
$4,300,000 |
4300000 |
3.80% |
3.80 |
0.14 |
0.135747 |
0.03 |
0.031569069767442 |
$31,676,575 |
31676574.8046 |
|
 Jim Thome
 |
Thome Jim |
DH |
$3,000,000 |
3000000 |
2.65% |
2.65 |
0.63 |
0.626308 |
0.21 |
0.20876933333333 |
$4,789,976 |
4789975.5391916 |
|
 Nick Blackburn
 |
Blackburn Nick |
RP |
$3,000,000 |
3000000 |
2.65% |
2.65 |
-1.55 |
-1.54645 |
— |
0 |
— |
0 |
|
 Tsuyoshi Nishioka
 |
Nishioka Tsuyoshi |
SS |
$3,000,000 |
3000000 |
2.65% |
2.65 |
-0.94 |
-0.936936 |
— |
0 |
— |
0 |
|
 Kevin Slowey
 |
Slowey Kevin |
RP |
$2,700,000 |
2700000 |
2.38% |
2.38 |
-0.65 |
-0.649464 |
— |
0 |
— |
0 |
|
 Denard Span
 |
Span Denard |
CF |
$1,000,000 |
1000000 |
0.88% |
0.88 |
1.35 |
1.35318 |
1.35 |
1.35318 |
$739,000 |
738999.98522 |
|
 Alexi Casilla
 |
Casilla Alexi |
2B |
$865,000 |
865000 |
0.76% |
0.76 |
1.95 |
1.94717 |
2.25 |
2.251063583815 |
$444,234 |
444234.45307806 |
|
 Glen Perkins
 |
Perkins Glen |
RP |
$700,000 |
700000 |
0.62% |
0.62 |
0.71 |
0.709991 |
1.01 |
1.0142728571429 |
$985,928 |
985927.9906365 |
|
 Jason Repko
 |
Repko Jason |
RF |
$600,000 |
600000 |
0.53% |
0.53 |
-0.45 |
-0.448364 |
— |
0 |
— |
0 |
|
 Brendan Harris
 |
Harris Brendan |
DNP |
$500,000 |
500000 |
0.44% |
0.44 |
— |
0.00 |
— |
0 |
— |
0 |
|
 Brian Duensing
 |
Duensing Brian |
RP |
$462,500 |
462500 |
0.41% |
0.41 |
-0.85 |
-0.848654 |
— |
0 |
— |
0 |
|
 Jose Mijares
 |
Mijares Jose |
RP |
$445,000 |
445000 |
0.39% |
0.39 |
-1.46 |
-1.45955 |
— |
0 |
— |
0 |
|
 Danny Valencia
 |
Valencia Danny |
3B |
$437,500 |
437500 |
0.39% |
0.39 |
-0.12 |
-0.123719 |
— |
0 |
— |
0 |
|
 Dusty Hughes
 |
Hughes Dusty |
RP |
$429,000 |
429000 |
0.38% |
0.38 |
-0.13 |
-0.127498 |
— |
0 |
— |
0 |
|
 Drew Butera
 |
Butera Drew |
C |
$429,000 |
429000 |
0.38% |
0.38 |
-2.16 |
-2.15616 |
— |
0 |
— |
0 |
|
 Matt Tolbert
 |
Tolbert Matt |
2B |
$425,000 |
425000 |
0.38% |
0.38 |
-1.68 |
-1.68443 |
— |
0 |
— |
0 |
|
 Jeff Manship
 |
Manship Jeff |
RP |
$419,000 |
419000 |
0.37% |
0.37 |
-0.13 |
-0.130967 |
— |
0 |
— |
0 |
|
| Year | Twins payroll |
PR Sort |
Avg payroll |
AvgPR Sort |
Diff |
Diff Sort |
|---|
| 1984 | $50,000 | 50000 | $260,000 | 260000 | $-210,000 | -210000 |
| 1985 | $130,000 | 130000 | $437,500 | 437500 | $-307,500 | -307500 |
| 1986 | $265,000 | 265000 | $552,000 | 552000 | $-287,000 | -287000 |
| 1987 | $465,000 | 465000 | $589,500 | 589500 | $-124,500 | -124500 |
| 1988 | $1,210,000 | 1210000 | $732,083 | 732083 | $477,917 | 477917 |
| 1989 | $2,050,000 | 2050000 | $862,714 | 862714 | $1,187,286 | 1187286 |
| 1990 | $2,700,000 | 2700000 | $1,203,571 | 1203571 | $1,496,429 | 1496429 |
| 1991 | $3,000,000 | 3000000 | $1,884,642 | 1884642 | $1,115,358 | 1115358 |
| 1992 | $3,300,000 | 3300000 | $2,356,071 | 2356071 | $943,929 | 943929 |
| 1993 | $5,200,000 | 5200000 | $3,410,000 | 3410000 | $1,790,000 | 1790000 |
| 1994 | $5,200,000 | 5200000 | $3,911,904 | 3911904 | $1,288,096 | 1288096 |
| 1995 | $6,200,000 | 6200000 | $5,208,333 | 5208333 | $991,667 | 991667 |
| 1996 | $6,200,000 | 6200000 | $4,583,416 | 4583416 | $1,616,584 | 1616584 |
| 1997 | $7,200,000 | 7200000 | $4,892,222 | 4892222 | $2,307,778 | 2307778 |
| 2000 | $16,542,500 | 16542500 | $56,164,089 | 56164089 | $-39,621,589 | -39621589 |
| 2001 | $23,930,000 | 23930000 | $65,991,638 | 65991638 | $-42,061,638 | -42061638 |
| 2002 | $39,950,000 | 39950000 | $68,244,471 | 68244471 | $-28,294,471 | -28294471 |
| 2003 | $55,275,000 | 55275000 | $71,318,479 | 71318479 | $-16,043,479 | -16043479 |
| 2004 | $53,815,000 | 53815000 | $70,466,961 | 70466961 | $-16,651,961 | -16651961 |
| 2005 | $56,556,000 | 56556000 | $73,264,780 | 73264780 | $-16,708,780 | -16708780 |
| 2006 | $65,024,500 | 65024500 | $79,051,754 | 79051754 | $-14,027,254 | -14027254 |
| 2007 | $72,189,500 | 72189500 | $83,931,138 | 83931138 | $-11,741,638 | -11741638 |
| 2008 | $61,442,667 | 61442667 | $90,812,373 | 90812373 | $-29,369,706 | -29369706 |
| 2009 | $67,027,267 | 67027267 | $91,093,211 | 91093211 | $-24,065,944 | -24065944 |
| 2010 | $98,159,167 | 98159167 | $93,373,681 | 93373681 | $4,785,486 | 4785486 |
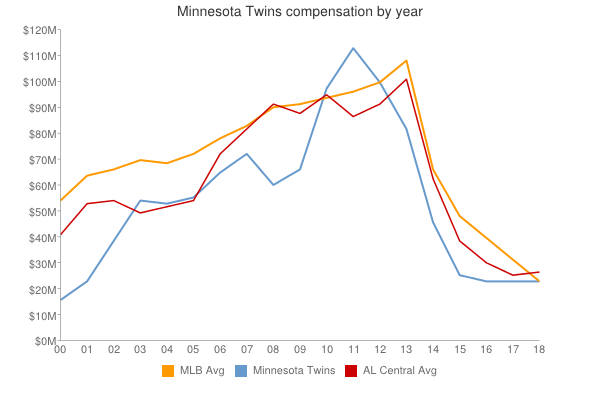
| 2011 | $113,237,000 | 113237000 | $96,102,034 | 96102034 | $17,134,966 | 17134966 |
| 2012 | $100,431,000 | 100431000 | $100,657,138 | 100657138 | $-226,138 | -226138 |
| 2013 | $82,010,000 | 82010000 | $109,024,990 | 109024990 | $-27,014,990 | -27014990 |
| 2014 | $92,874,836 | 92874836 | $117,828,782 | 117828782 | $-24,953,946 | -24953946 |
| 2015 | $108,262,500 | 108262500 | $127,404,244 | 127404244 | $-19,141,744 | -19141744 |
| 2016 | $105,333,700 | 105333700 | $132,219,407 | 132219407 | $-26,885,707 | -26885707 |
| 2017 | $108,102,500 | 108102500 | $137,302,894 | 137302894 | $-29,200,394 | -29200394 |
| 2018 | $128,713,226 | 128713226 | $136,929,168 | 136929168 | $-8,215,942 | -8215942 |
| 2019 | $119,651,933 | 119651933 | $136,944,257 | 136944257 | $-17,292,324 | -17292324 |
| 2020 | $131,799,311 | 131799311 | $140,677,788 | 140677788 | $-8,878,477 | -8878477 |
| 2021 | $131,678,167 | 131678167 | $132,162,631 | 132162631 | $-484,464 | -484464 |
| 2022 | $141,020,356 | 141020356 | $149,374,046 | 149374046 | $-8,353,690 | -8353690 |
| 2023 | $154,063,740 | 154063740 | $160,460,390 | 160460390 | $-6,396,650 | -6396650 |
| 2024 | $108,346,590 | 108346590 | $135,504,022 | 135504022 | $-27,157,432 | -27157432 |
| 2025 | $96,981,190 | 96981190 | $96,417,302 | 96417302 | $563,888 | 563888 |
| 2026 | $70,726,190 | 70726190 | $76,694,120 | 76694120 | $-5,967,930 | -5967930 |
| 2027 | $68,726,190 | 68726190 | $58,935,617 | 58935617 | $9,790,573 | 9790573 |
| 2028 | $46,476,190 | 46476190 | $45,437,759 | 45437759 | $1,038,431 | 1038431 |
|
 2011 Minnesota Twins