| Player | Player Sort | Pos | Salary | Salary Sort | Pct | Pct Sort | WARP | WARP Sort | WARP/$M | WARP/$M Sort | $/WARP | $/WARP Sort | Current Status |
|---|
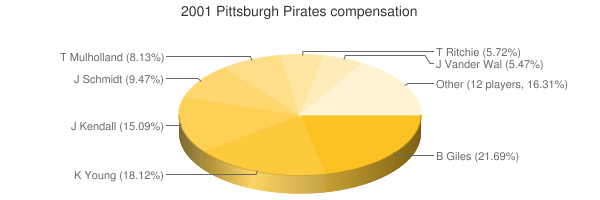
 Brian Giles
 |
Giles Brian |
LF |
$7,333,333 |
7333333 |
13.07% |
13.07 |
5.62 |
5.6242 |
0.77 |
0.76693639849711 |
$1,303,889 |
1303889.0864479 |
|
 Kevin Young
 |
Young Kevin |
1B |
$6,125,000 |
6125000 |
10.92% |
10.92 |
0.04 |
0.0413096 |
0.01 |
0.0067444244897959 |
$148,270,620 |
148270619.90433 |
|
 Jason Kendall
 |
Kendall Jason |
C |
$5,100,000 |
5100000 |
9.09% |
9.09 |
-0.56 |
-0.563075 |
— |
0 |
— |
0 |
|
 Derek Bell
 |
Bell Derek |
RF |
$5,000,000 |
5000000 |
8.91% |
8.91 |
-0.87 |
-0.873719 |
— |
0 |
— |
0 |
|
 Omar Olivares
 |
Olivares Omar |
RP |
$4,000,000 |
4000000 |
7.13% |
7.13 |
-0.51 |
-0.506078 |
— |
0 |
— |
0 |
|
 Francisco Cordova
 |
Cordova Francisco |
DNP |
$3,850,000 |
3850000 |
6.86% |
6.86 |
— |
0.00 |
— |
0 |
— |
0 |
|
 Pat Meares
 |
Meares Pat |
2B |
$3,790,000 |
3790000 |
6.75% |
6.75 |
-1.78 |
-1.77831 |
— |
0 |
— |
0 |
|
 Kris Benson
 |
Benson Kris |
DNP |
$3,450,000 |
3450000 |
6.15% |
6.15 |
— |
0.00 |
— |
0 |
— |
0 |
|
 Jason Schmidt
 |
Schmidt Jason |
RP |
$3,200,000 |
3200000 |
5.70% |
5.70 |
1.74 |
1.74134 |
0.54 |
0.54416875 |
$1,837,665 |
1837665.2463046 |
|
 Terry Mulholland
 |
Mulholland Terry |
RP |
$2,750,000 |
2750000 |
4.90% |
4.90 |
0.43 |
0.433258 |
0.16 |
0.15754836363636 |
$6,347,257 |
6347257.2924216 |
|
 Todd Ritchie
 |
Ritchie Todd |
RP |
$1,933,333 |
1933333 |
3.45% |
3.45 |
2.99 |
2.9855 |
1.54 |
1.5442244041766 |
$647,574 |
647574.27566572 |
|
 John Vander Wal
 |
Vander Wal John |
RF |
$1,850,000 |
1850000 |
3.30% |
3.30 |
-0.31 |
-0.309009 |
— |
0 |
— |
0 |
|
 Mike Williams
 |
Williams Mike |
RP |
$1,200,000 |
1200000 |
2.14% |
2.14 |
0.06 |
0.0603306 |
0.05 |
0.0502755 |
$19,890,404 |
19890403.874651 |
|
 Mike Benjamin
 |
Benjamin Mike |
DNP |
$925,000 |
925000 |
1.65% |
1.65 |
— |
0.00 |
— |
0 |
— |
0 |
|
 Keith Osik
 |
Osik Keith |
C |
$887,500 |
887500 |
1.58% |
1.58 |
0.38 |
0.379879 |
0.43 |
0.42803267605634 |
$2,336,270 |
2336270.2334164 |
|
 Rich Loiselle
 |
Loiselle Rich |
RP |
$775,000 |
775000 |
1.38% |
1.38 |
-0.62 |
-0.616189 |
— |
0 |
— |
0 |
|
 Enrique Wilson
 |
Wilson Enrique |
SS |
$635,000 |
635000 |
1.13% |
1.13 |
-1.15 |
-1.15436 |
— |
0 |
— |
0 |
|
 Josias Manzanillo
 |
Manzanillo Josias |
RP |
$550,000 |
550000 |
0.98% |
0.98 |
1.87 |
1.87374 |
3.41 |
3.4068 |
$293,531 |
293530.58588705 |
|
 Marc Wilkins
 |
Wilkins Marc |
RP |
$500,000 |
500000 |
0.89% |
0.89 |
-0.27 |
-0.270736 |
— |
0 |
— |
0 |
|
 Scott Sauerbeck
 |
Sauerbeck Scott |
RP |
$416,667 |
416667 |
0.74% |
0.74 |
1.19 |
1.19042 |
2.86 |
2.8570057143954 |
$350,017 |
350016.800793 |
|
 Adrian Brown
 |
Brown Adrian |
CF |
$380,000 |
380000 |
0.68% |
0.68 |
-0.11 |
-0.109869 |
— |
0 |
— |
0 |
|
 Aramis Ramirez
 |
Ramirez Aramis |
3B |
$285,000 |
285000 |
0.51% |
0.51 |
4.57 |
4.57329 |
16.05 |
16.046631578947 |
$62,318 |
62318.374736787 |
|
 Jimmy Anderson
 |
Anderson Jimmy |
RP |
$285,000 |
285000 |
0.51% |
0.51 |
-1.42 |
-1.42257 |
— |
0 |
— |
0 |
|
 Emil Brown
 |
Brown Emil |
CF |
$265,000 |
265000 |
0.47% |
0.47 |
0.41 |
0.411811 |
1.55 |
1.5540037735849 |
$643,499 |
643499.08088905 |
|
 Bronson Arroyo
 |
Arroyo Bronson |
RP |
$225,000 |
225000 |
0.40% |
0.40 |
-1.43 |
-1.43127 |
— |
0 |
— |
0 |
|
 Joe Beimel
 |
Beimel Joe |
RP |
$200,000 |
200000 |
0.36% |
0.36 |
-1.76 |
-1.75959 |
— |
0 |
— |
0 |
|
 Jack Wilson
 |
Wilson Jack |
SS |
$200,000 |
200000 |
0.36% |
0.36 |
0.23 |
0.230621 |
1.15 |
1.153105 |
$867,224 |
867223.71336522 |
|
| Year | Pirates payroll |
PR Sort |
Avg payroll |
AvgPR Sort |
Diff |
Diff Sort |
|---|
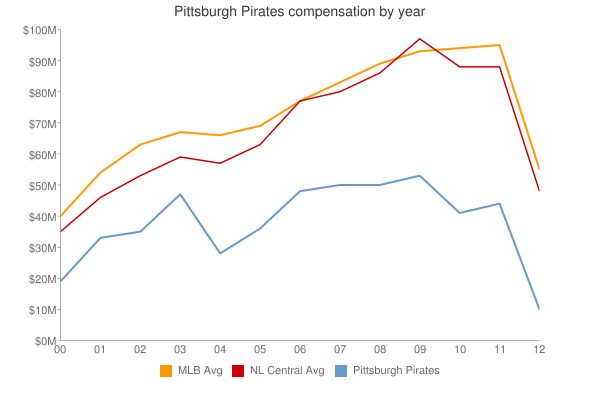
| 2000 | $27,423,334 | 27423334 | $55,368,142 | 55368142 | $-27,944,808 | -27944808 |
| 2001 | $56,110,833 | 56110833 | $64,937,084 | 64937084 | $-8,826,251 | -8826251 |
| 2002 | $41,911,099 | 41911099 | $67,238,672 | 67238672 | $-25,327,573 | -25327573 |
| 2003 | $54,761,833 | 54761833 | $70,654,480 | 70654480 | $-15,892,647 | -15892647 |
| 2004 | $30,716,500 | 30716500 | $69,466,729 | 69466729 | $-38,750,229 | -38750229 |
| 2005 | $36,170,500 | 36170500 | $74,114,841 | 74114841 | $-37,944,341 | -37944341 |
| 2006 | $47,700,750 | 47700750 | $79,621,815 | 79621815 | $-31,921,065 | -31921065 |
| 2007 | $41,444,500 | 41444500 | $85,537,470 | 85537470 | $-44,092,970 | -44092970 |
| 2008 | $49,113,225 | 49113225 | $92,003,799 | 92003799 | $-42,890,574 | -42890574 |
| 2009 | $51,864,000 | 51864000 | $92,169,598 | 92169598 | $-40,305,598 | -40305598 |
| 2010 | $38,668,000 | 38668000 | $94,342,601 | 94342601 | $-55,674,601 | -55674601 |
| 2011 | $44,485,667 | 44485667 | $96,974,710 | 96974710 | $-52,489,043 | -52489043 |
| 2012 | $51,932,000 | 51932000 | $100,947,217 | 100947217 | $-49,015,217 | -49015217 |
| 2013 | $66,805,000 | 66805000 | $108,586,966 | 108586966 | $-41,781,966 | -41781966 |
| 2014 | $71,929,333 | 71929333 | $117,131,361 | 117131361 | $-45,202,028 | -45202028 |
| 2015 | $90,303,000 | 90303000 | $126,168,161 | 126168161 | $-35,865,161 | -35865161 |
| 2016 | $99,945,500 | 99945500 | $131,756,569 | 131756569 | $-31,811,069 | -31811069 |
| 2017 | $95,807,004 | 95807004 | $136,337,445 | 136337445 | $-40,530,441 | -40530441 |
| 2018 | $86,340,001 | 86340001 | $135,360,600 | 135360600 | $-49,020,599 | -49020599 |
| 2019 | $74,808,000 | 74808000 | $134,792,134 | 134792134 | $-59,984,134 | -59984134 |
| 2020 | $53,939,500 | 53939500 | $139,496,467 | 139496467 | $-85,556,967 | -85556967 |
| 2021 | $55,452,000 | 55452000 | $130,712,288 | 130712288 | $-75,260,288 | -75260288 |
| 2022 | $55,761,800 | 55761800 | $149,802,695 | 149802695 | $-94,040,895 | -94040895 |
| 2023 | $72,777,500 | 72777500 | $161,692,345 | 161692345 | $-88,914,845 | -88914845 |
| 2024 | $53,029,000 | 53029000 | $136,306,249 | 136306249 | $-83,277,249 | -83277249 |
| 2025 | $34,661,500 | 34661500 | $98,329,527 | 98329527 | $-63,668,027 | -63668027 |
| 2026 | $38,161,500 | 38161500 | $78,039,273 | 78039273 | $-39,877,773 | -39877773 |
| 2027 | $40,661,500 | 40661500 | $60,919,343 | 60919343 | $-20,257,843 | -20257843 |
| 2028 | $43,661,500 | 43661500 | $46,901,712 | 46901712 | $-3,240,212 | -3240212 |
| 2029 | $23,250,000 | 23250000 | $38,597,944 | 38597944 | $-15,347,944 | -15347944 |
| 2030 | $21,250,000 | 21250000 | $41,447,579 | 41447579 | $-20,197,579 | -20197579 |
| 2031 | $2,000,000 | 2000000 | $38,360,152 | 38360152 | $-36,360,152 | -36360152 |
|
 2001 Pittsburgh Pirates