| Player | Player Sort | Pos | Salary | Salary Sort | Pct | Pct Sort | WARP | WARP Sort | WARP/$M | WARP/$M Sort | $/WARP | $/WARP Sort | Current Status |
|---|
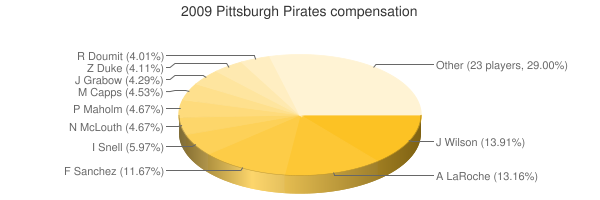
 Jack Wilson
 |
Wilson Jack |
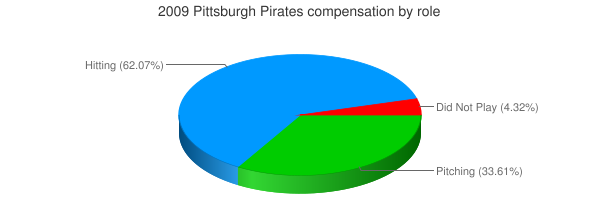
SS |
$7,450,000 |
7450000 |
14.36% |
14.36 |
1.51 |
1.50792 |
0.20 |
0.20240536912752 |
$4,940,580 |
4940580.4021433 |
|
 Adam LaRoche
 |
LaRoche Adam |
1B |
$7,050,000 |
7050000 |
13.59% |
13.59 |
1.20 |
1.20092 |
0.17 |
0.17034326241135 |
$5,870,499 |
5870499.2838824 |
|
 Freddy Sanchez
 |
Sanchez Freddy |
2B |
$6,250,000 |
6250000 |
12.05% |
12.05 |
0.42 |
0.419675 |
0.07 |
0.067148 |
$14,892,476 |
14892476.320963 |
|
 Ian Snell
 |
Snell Ian |
RP |
$3,200,000 |
3200000 |
6.17% |
6.17 |
0.92 |
0.921121 |
0.29 |
0.2878503125 |
$3,474,028 |
3474027.8421619 |
|
 Nate McLouth
 |
McLouth Nate |
CF |
$2,500,000 |
2500000 |
4.82% |
4.82 |
1.42 |
1.41637 |
0.57 |
0.566548 |
$1,765,076 |
1765075.5099303 |
|
 Paul Maholm
 |
Maholm Paul |
RP |
$2,500,000 |
2500000 |
4.82% |
4.82 |
3.09 |
3.09423 |
1.24 |
1.237692 |
$807,955 |
807955.45256817 |
|
 Matt Capps
 |
Capps Matt |
RP |
$2,425,000 |
2425000 |
4.68% |
4.68 |
-0.13 |
-0.127867 |
— |
0 |
— |
0 |
|
 John Grabow
 |
Grabow John |
RP |
$2,300,000 |
2300000 |
4.43% |
4.43 |
0.31 |
0.313572 |
0.14 |
0.13633565217391 |
$7,334,839 |
7334838.5697703 |
|
 Zach Duke
 |
Duke Zach |
RP |
$2,200,000 |
2200000 |
4.24% |
4.24 |
3.56 |
3.56208 |
1.62 |
1.6191272727273 |
$617,617 |
617616.6734043 |
|
 Ryan Doumit
 |
Doumit Ryan |
C |
$2,150,000 |
2150000 |
4.15% |
4.15 |
-1.34 |
-1.33578 |
— |
0 |
— |
0 |
|
 Pedro Álvarez
 |
Alvarez Pedro |
DNP |
$1,900,000 |
1900000 |
3.66% |
3.66 |
— |
0.00 |
— |
0 |
— |
0 |
|
 Ramón Vázquez
 |
Vazquez Ramon |
PH |
$1,875,000 |
1875000 |
3.62% |
3.62 |
-0.21 |
-0.205615 |
— |
0 |
— |
0 |
|
 Eric Hinske
 |
Hinske Eric |
PH |
$1,500,000 |
1500000 |
2.89% |
2.89 |
0.38 |
0.37778 |
0.25 |
0.25185333333333 |
$3,970,565 |
3970564.8790301 |
|
 Tyler Yates
 |
Yates Tyler |
RP |
$1,300,000 |
1300000 |
2.51% |
2.51 |
0.14 |
0.140689 |
0.11 |
0.10822230769231 |
$9,240,239 |
9240239.1089566 |
FA/2011 |
 Craig Hansen
 |
Hansen Craig |
RP |
$825,000 |
825000 |
1.59% |
1.59 |
0.02 |
0.021581 |
0.03 |
0.026158787878788 |
$38,228,071 |
38228070.988369 |
|
 Craig Monroe
 |
Monroe Craig |
PH |
$750,000 |
750000 |
1.45% |
1.45 |
-0.05 |
-0.0537474 |
— |
0 |
— |
0 |
|
 Brandon Moss
 |
Moss Brandon |
RF |
$414,500 |
414500 |
0.80% |
0.80 |
-0.46 |
-0.458964 |
— |
0 |
— |
0 |
|
 Ross Ohlendorf
 |
Ohlendorf Ross |
RP |
$413,500 |
413500 |
0.80% |
0.80 |
0.57 |
0.570926 |
1.38 |
1.3807158403869 |
$724,262 |
724261.98841881 |
|
 Andy LaRoche
 |
LaRoche Andy |
3B |
$413,500 |
413500 |
0.80% |
0.80 |
2.64 |
2.63995 |
6.38 |
6.3844014510278 |
$156,632 |
156631.75438929 |
|
 Nyjer Morgan
 |
Morgan Nyjer |
LF |
$411,500 |
411500 |
0.79% |
0.79 |
2.11 |
2.11322 |
5.14 |
5.1354070473876 |
$194,727 |
194726.5310758 |
|
 Dana Eveland
 |
Eveland Dana |
DNP |
$410,000 |
410000 |
0.79% |
0.79 |
— |
0.00 |
— |
0 |
— |
0 |
|
 Sean Burnett
 |
Burnett Sean |
RP |
$408,500 |
408500 |
0.79% |
0.79 |
0.05 |
0.0522826 |
0.13 |
0.12798678090575 |
$7,813,307 |
7813306.9128161 |
|
 Delwyn Young
 |
Young Delwyn |
2B |
$406,000 |
406000 |
0.78% |
0.78 |
-0.96 |
-0.961745 |
— |
0 |
— |
0 |
|
 Charlie Morton
 |
Morton Charlie |
RP |
$405,000 |
405000 |
0.78% |
0.78 |
0.17 |
0.165806 |
0.41 |
0.4093975308642 |
$2,442,614 |
2442613.6569244 |
|
 Jesse Chavez
 |
Chavez Jesse |
RP |
$402,000 |
402000 |
0.78% |
0.78 |
0.58 |
0.57883 |
1.44 |
1.4398756218905 |
$694,504 |
694504.4313529 |
|
 Luis Alfonso Cruz
 |
Cruz Luis Alfonso |
SS |
$401,500 |
401500 |
0.77% |
0.77 |
-0.11 |
-0.107879 |
— |
0 |
— |
0 |
|
 Jeff Karstens
 |
Karstens Jeff |
RP |
$401,500 |
401500 |
0.77% |
0.77 |
-0.55 |
-0.55443 |
— |
0 |
— |
0 |
|
 Phil Dumatrait
 |
Dumatrait Phil |
RP |
$401,500 |
401500 |
0.77% |
0.77 |
-0.47 |
-0.469652 |
— |
0 |
— |
0 |
|
 Jason Jaramillo
 |
Jaramillo Jason |
C |
$400,000 |
400000 |
0.77% |
0.77 |
-1.07 |
-1.0718 |
— |
0 |
— |
0 |
|
 Donnie Veal
 |
Veal Donnie |
RP |
$400,000 |
400000 |
0.77% |
0.77 |
-0.58 |
-0.582728 |
— |
0 |
— |
0 |
|
| Year | Pirates payroll |
PR Sort |
Avg payroll |
AvgPR Sort |
Diff |
Diff Sort |
|---|
| 2000 | $27,423,334 | 27423334 | $56,164,089 | 56164089 | $-28,740,755 | -28740755 |
| 2001 | $56,110,833 | 56110833 | $65,991,638 | 65991638 | $-9,880,805 | -9880805 |
| 2002 | $41,911,099 | 41911099 | $68,244,471 | 68244471 | $-26,333,372 | -26333372 |
| 2003 | $54,761,833 | 54761833 | $71,318,479 | 71318479 | $-16,556,646 | -16556646 |
| 2004 | $30,716,500 | 30716500 | $70,466,961 | 70466961 | $-39,750,461 | -39750461 |
| 2005 | $36,170,500 | 36170500 | $73,264,780 | 73264780 | $-37,094,280 | -37094280 |
| 2006 | $47,700,750 | 47700750 | $79,051,754 | 79051754 | $-31,351,004 | -31351004 |
| 2007 | $41,444,500 | 41444500 | $83,931,138 | 83931138 | $-42,486,638 | -42486638 |
| 2008 | $49,113,225 | 49113225 | $90,812,373 | 90812373 | $-41,699,148 | -41699148 |
| 2009 | $51,864,000 | 51864000 | $91,093,211 | 91093211 | $-39,229,211 | -39229211 |
| 2010 | $38,668,000 | 38668000 | $93,373,681 | 93373681 | $-54,705,681 | -54705681 |
| 2011 | $44,485,667 | 44485667 | $96,102,034 | 96102034 | $-51,616,367 | -51616367 |
| 2012 | $51,932,000 | 51932000 | $100,657,138 | 100657138 | $-48,725,138 | -48725138 |
| 2013 | $66,805,000 | 66805000 | $109,024,990 | 109024990 | $-42,219,990 | -42219990 |
| 2014 | $71,929,333 | 71929333 | $117,828,782 | 117828782 | $-45,899,449 | -45899449 |
| 2015 | $90,303,000 | 90303000 | $127,404,244 | 127404244 | $-37,101,244 | -37101244 |
| 2016 | $99,945,500 | 99945500 | $132,219,407 | 132219407 | $-32,273,907 | -32273907 |
| 2017 | $95,807,004 | 95807004 | $137,302,894 | 137302894 | $-41,495,890 | -41495890 |
| 2018 | $86,340,001 | 86340001 | $136,929,168 | 136929168 | $-50,589,167 | -50589167 |
| 2019 | $74,808,000 | 74808000 | $136,944,257 | 136944257 | $-62,136,257 | -62136257 |
| 2020 | $53,939,500 | 53939500 | $140,677,788 | 140677788 | $-86,738,288 | -86738288 |
| 2021 | $55,452,000 | 55452000 | $132,162,631 | 132162631 | $-76,710,631 | -76710631 |
| 2022 | $55,761,800 | 55761800 | $149,374,046 | 149374046 | $-93,612,246 | -93612246 |
| 2023 | $72,777,500 | 72777500 | $160,460,390 | 160460390 | $-87,682,890 | -87682890 |
| 2024 | $53,029,000 | 53029000 | $135,504,022 | 135504022 | $-82,475,022 | -82475022 |
| 2025 | $34,661,500 | 34661500 | $96,417,302 | 96417302 | $-61,755,802 | -61755802 |
| 2026 | $38,161,500 | 38161500 | $76,694,120 | 76694120 | $-38,532,620 | -38532620 |
| 2027 | $40,661,500 | 40661500 | $58,935,617 | 58935617 | $-18,274,117 | -18274117 |
| 2028 | $43,661,500 | 43661500 | $45,437,759 | 45437759 | $-1,776,259 | -1776259 |
| 2029 | $23,250,000 | 23250000 | $37,269,628 | 37269628 | $-14,019,628 | -14019628 |
| 2030 | $21,250,000 | 21250000 | $39,665,769 | 39665769 | $-18,415,769 | -18415769 |
| 2031 | $2,000,000 | 2000000 | $38,360,152 | 38360152 | $-36,360,152 | -36360152 |
|
 2009 Pittsburgh Pirates