| Player | Player Sort | Pos | Salary | Salary Sort | Pct | Pct Sort | WARP | WARP Sort | WARP/$M | WARP/$M Sort | $/WARP | $/WARP Sort | Current Status |
|---|
 Russell Martin
 |
Martin Russell |
C |
$9,500,000 |
9500000 |
13.21% |
13.21 |
6.70 |
6.70011 |
0.71 |
0.70527473684211 |
$1,417,887 |
1417887.1690166 |
|
 Wandy Rodriguez
 |
Rodriguez Wandy |
RP |
$7,500,000 |
7500000 |
10.43% |
10.43 |
-0.38 |
-0.384435 |
— |
0 |
— |
0 |
|
 Andrew McCutchen
 |
McCutchen Andrew |
CF |
$7,458,333 |
7458333 |
10.37% |
10.37 |
6.23 |
6.23235 |
0.84 |
0.83562238371497 |
$1,196,713 |
1196712.7969386 |
|
 Francisco Liriano
 |
Liriano Francisco |
RP |
$6,000,000 |
6000000 |
8.34% |
8.34 |
3.08 |
3.07758 |
0.51 |
0.51293 |
$1,949,584 |
1949583.7638664 |
|
 Neil Walker
 |
Walker Neil |
2B |
$5,750,000 |
5750000 |
7.99% |
7.99 |
3.18 |
3.18342 |
0.55 |
0.55363826086957 |
$1,806,234 |
1806233.5475683 |
|
 Edinson Vólquez
 |
Volquez Edinson |
RP |
$5,000,000 |
5000000 |
6.95% |
6.95 |
1.52 |
1.52062 |
0.30 |
0.304124 |
$3,288,132 |
3288132.472281 |
|
 Jason Grilli
 |
Grilli Jason |
RP |
$4,250,000 |
4250000 |
5.91% |
5.91 |
0.02 |
0.0185466 |
0.00 |
0.0043639058823529 |
$229,152,513 |
229152513.12909 |
|
 Pedro Álvarez
 |
Alvarez Pedro |
3B |
$4,250,000 |
4250000 |
5.91% |
5.91 |
2.02 |
2.01666 |
0.47 |
0.47450823529412 |
$2,107,445 |
2107444.9832892 |
|
 Charlie Morton
 |
Morton Charlie |
RP |
$4,000,000 |
4000000 |
5.56% |
5.56 |
0.88 |
0.879245 |
0.22 |
0.21981125 |
$4,549,358 |
4549357.6875615 |
|
 Jose Tabata
 |
Tabata Jose |
PH |
$3,166,667 |
3166667 |
4.40% |
4.40 |
-0.55 |
-0.552378 |
— |
0 |
— |
0 |
|
 Mark Melancon
 |
Melancon Mark |
RP |
$2,595,000 |
2595000 |
3.61% |
3.61 |
2.09 |
2.08598 |
0.80 |
0.80384585741811 |
$1,244,020 |
1244019.5975033 |
|
 Gaby Sanchez
 |
Sanchez Gaby |
1B |
$2,300,000 |
2300000 |
3.20% |
3.20 |
0.56 |
0.561486 |
0.24 |
0.24412434782609 |
$4,096,273 |
4096273.1038708 |
|
 Clint Barmes
 |
Barmes Clint |
SS |
$2,000,000 |
2000000 |
2.78% |
2.78 |
0.04 |
0.044481 |
0.02 |
0.0222405 |
$44,963,018 |
44963017.917763 |
|
 Travis Snider
 |
Snider Travis |
RF |
$1,200,000 |
1200000 |
1.67% |
1.67 |
1.67 |
1.66721 |
1.39 |
1.3893416666667 |
$719,765 |
719765.35649378 |
|
 Chris Stewart
 |
Stewart Chris |
C |
$1,000,000 |
1000000 |
1.39% |
1.39 |
1.33 |
1.33345 |
1.33 |
1.33345 |
$749,934 |
749934.38074169 |
|
 Starling Marte
 |
Marte Starling |
LF |
$833,333 |
833333 |
1.16% |
1.16 |
3.23 |
3.22633 |
3.87 |
3.871597548639 |
$258,291 |
258291.3093205 |
|
 Tony Watson
 |
Watson Tony |
RP |
$518,500 |
518500 |
0.72% |
0.72 |
1.53 |
1.52731 |
2.95 |
2.9456316297011 |
$339,486 |
339485.76254984 |
|
 Jordy Mercer
 |
Mercer Jordy |
SS |
$515,500 |
515500 |
0.72% |
0.72 |
3.55 |
3.54861 |
6.88 |
6.8838215324927 |
$145,268 |
145268.14724639 |
|
 Justin Wilson
 |
Wilson Justin |
RP |
$515,000 |
515000 |
0.72% |
0.72 |
0.31 |
0.31136 |
0.60 |
0.60458252427184 |
$1,654,034 |
1654033.9157246 |
|
 Jeanmar Gómez
 |
Gomez Jeanmar |
RP |
$514,500 |
514500 |
0.72% |
0.72 |
-0.56 |
-0.562145 |
— |
0 |
— |
0 |
|
 Jeff Locke
 |
Locke Jeff |
RP |
$513,000 |
513000 |
0.71% |
0.71 |
0.83 |
0.832692 |
1.62 |
1.6231812865497 |
$616,074 |
616074.13065095 |
|
 Josh Harrison
 |
Harrison Josh |
3B |
$513,000 |
513000 |
0.71% |
0.71 |
4.96 |
4.95748 |
9.66 |
9.6637037037037 |
$103,480 |
103479.99386785 |
|
 Gerrit Cole
 |
Cole Gerrit |
RP |
$512,500 |
512500 |
0.71% |
0.71 |
4.12 |
4.11893 |
8.04 |
8.0369365853659 |
$124,426 |
124425.51827781 |
|
 Bryan Morris
 |
Morris Bryan |
RP |
$511,500 |
511500 |
0.71% |
0.71 |
0.21 |
0.214858 |
0.42 |
0.42005474095797 |
$2,380,642 |
2380642.0985023 |
|
 Tony Sanchez
 |
Sanchez Tony |
C |
$507,000 |
507000 |
0.70% |
0.70 |
-0.01 |
-0.00662568 |
— |
0 |
— |
0 |
|
 Stolmy Pimentel
 |
Pimentel Stolmy |
RP |
$505,500 |
505500 |
0.70% |
0.70 |
-0.03 |
-0.0292892 |
— |
0 |
— |
0 |
|
| Year | Pirates payroll |
PR Sort |
Avg payroll |
AvgPR Sort |
Diff |
Diff Sort |
|---|
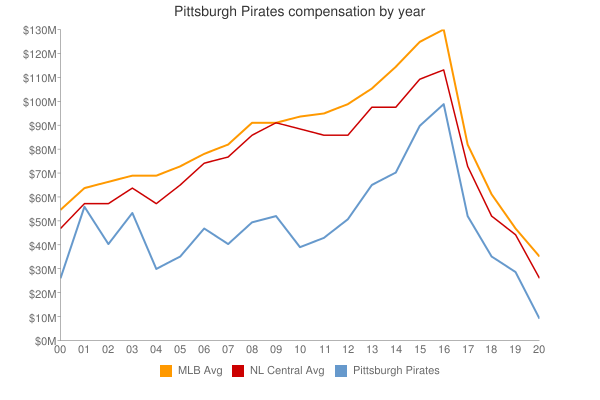
| 2000 | $27,423,334 | 27423334 | $57,491,092 | 57491092 | $-30,067,758 | -30067758 |
| 2001 | $56,110,833 | 56110833 | $67,120,750 | 67120750 | $-11,009,917 | -11009917 |
| 2002 | $41,911,099 | 41911099 | $69,204,705 | 69204705 | $-27,293,606 | -27293606 |
| 2003 | $54,761,833 | 54761833 | $72,156,639 | 72156639 | $-17,394,806 | -17394806 |
| 2004 | $30,716,500 | 30716500 | $71,426,357 | 71426357 | $-40,709,857 | -40709857 |
| 2005 | $36,170,500 | 36170500 | $73,628,169 | 73628169 | $-37,457,669 | -37457669 |
| 2006 | $47,700,750 | 47700750 | $81,192,832 | 81192832 | $-33,492,082 | -33492082 |
| 2007 | $41,444,500 | 41444500 | $85,747,487 | 85747487 | $-44,302,987 | -44302987 |
| 2008 | $49,113,225 | 49113225 | $93,079,041 | 93079041 | $-43,965,816 | -43965816 |
| 2009 | $51,864,000 | 51864000 | $92,957,049 | 92957049 | $-41,093,049 | -41093049 |
| 2010 | $38,668,000 | 38668000 | $94,957,956 | 94957956 | $-56,289,956 | -56289956 |
| 2011 | $44,485,667 | 44485667 | $97,426,414 | 97426414 | $-52,940,747 | -52940747 |
| 2012 | $51,932,000 | 51932000 | $100,689,500 | 100689500 | $-48,757,500 | -48757500 |
| 2013 | $66,805,000 | 66805000 | $106,658,387 | 106658387 | $-39,853,387 | -39853387 |
| 2014 | $71,929,333 | 71929333 | $115,428,670 | 115428670 | $-43,499,337 | -43499337 |
| 2015 | $90,303,000 | 90303000 | $125,458,486 | 125458486 | $-35,155,486 | -35155486 |
| 2016 | $99,945,500 | 99945500 | $130,290,910 | 130290910 | $-30,345,410 | -30345410 |
| 2017 | $95,807,004 | 95807004 | $136,573,000 | 136573000 | $-40,765,996 | -40765996 |
| 2018 | $86,340,001 | 86340001 | $135,681,867 | 135681867 | $-49,341,866 | -49341866 |
| 2019 | $74,808,000 | 74808000 | $134,776,225 | 134776225 | $-59,968,225 | -59968225 |
| 2020 | $53,939,500 | 53939500 | $138,321,485 | 138321485 | $-84,381,985 | -84381985 |
| 2021 | $55,452,000 | 55452000 | $129,635,938 | 129635938 | $-74,183,938 | -74183938 |
| 2022 | $55,761,800 | 55761800 | $147,002,411 | 147002411 | $-91,240,611 | -91240611 |
| 2023 | $72,777,500 | 72777500 | $158,155,877 | 158155877 | $-85,378,377 | -85378377 |
| 2024 | $53,029,000 | 53029000 | $133,074,721 | 133074721 | $-80,045,721 | -80045721 |
| 2025 | $34,661,500 | 34661500 | $94,180,059 | 94180059 | $-59,518,559 | -59518559 |
| 2026 | $38,161,500 | 38161500 | $74,818,461 | 74818461 | $-36,656,961 | -36656961 |
| 2027 | $40,661,500 | 40661500 | $56,972,319 | 56972319 | $-16,310,819 | -16310819 |
| 2028 | $43,661,500 | 43661500 | $45,437,759 | 45437759 | $-1,776,259 | -1776259 |
| 2029 | $23,250,000 | 23250000 | $37,269,628 | 37269628 | $-14,019,628 | -14019628 |
| 2030 | $21,250,000 | 21250000 | $39,665,769 | 39665769 | $-18,415,769 | -18415769 |
| 2031 | $2,000,000 | 2000000 | $38,360,152 | 38360152 | $-36,360,152 | -36360152 |
|
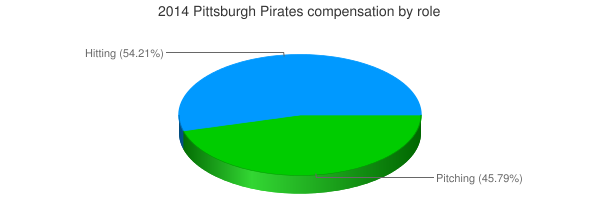
 2014 Pittsburgh Pirates