| Player | Player Sort | Pos | Salary | Salary Sort | Pct | Pct Sort | WARP | WARP Sort | WARP/$M | WARP/$M Sort | $/WARP | $/WARP Sort | Current Status |
|---|
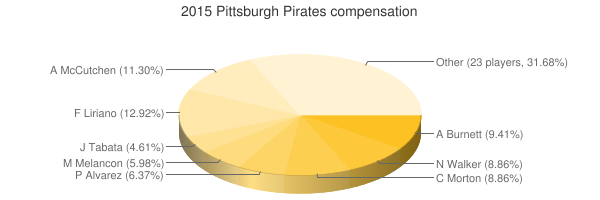
 Francisco Liriano
 |
Liriano Francisco |
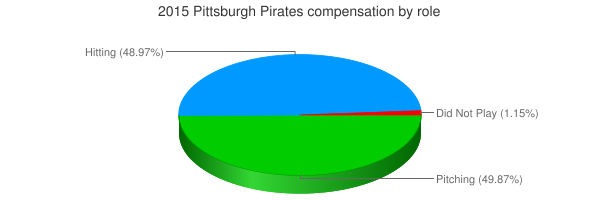
RP |
$11,666,667 |
11666667 |
12.92% |
12.92 |
5.00 |
5.00018 |
0.43 |
0.42858684489752 |
$2,333,249 |
2333249.4030215 |
|
 Andrew McCutchen
 |
McCutchen Andrew |
CF |
$10,208,333 |
10208333 |
11.30% |
11.30 |
5.49 |
5.49243 |
0.54 |
0.53803397675213 |
$1,858,619 |
1858618.6806204 |
|
 A.J. Burnett
 |
Burnett A.J. |
RP |
$8,500,000 |
8500000 |
9.41% |
9.41 |
2.16 |
2.15586 |
0.25 |
0.25363058823529 |
$3,942,742 |
3942742.107558 |
|
 Charlie Morton
 |
Morton Charlie |
RP |
$8,000,000 |
8000000 |
8.86% |
8.86 |
-0.33 |
-0.331848 |
— |
0 |
— |
0 |
|
 Neil Walker
 |
Walker Neil |
2B |
$8,000,000 |
8000000 |
8.86% |
8.86 |
3.67 |
3.66647 |
0.46 |
0.45830875 |
$2,181,935 |
2181935.2128887 |
|
 Pedro Álvarez
 |
Alvarez Pedro |
1B |
$5,750,000 |
5750000 |
6.37% |
6.37 |
2.59 |
2.59496 |
0.45 |
0.45129739130435 |
$2,215,834 |
2215833.7700774 |
|
 Mark Melancon
 |
Melancon Mark |
RP |
$5,400,000 |
5400000 |
5.98% |
5.98 |
2.11 |
2.11091 |
0.39 |
0.39090925925926 |
$2,558,138 |
2558138.4331876 |
|
 Jose Tabata
 |
Tabata Jose |
PH |
$4,166,667 |
4166667 |
4.61% |
4.61 |
-0.04 |
-0.0359215 |
— |
0 |
— |
0 |
|
 Antonio Bastardo
 |
Bastardo Antonio |
RP |
$3,100,000 |
3100000 |
3.43% |
3.43 |
0.80 |
0.804396 |
0.26 |
0.25948258064516 |
$3,853,823 |
3853823.2412891 |
|
 Josh Harrison
 |
Harrison Josh |
3B |
$3,050,000 |
3050000 |
3.38% |
3.38 |
2.17 |
2.17114 |
0.71 |
0.71184918032787 |
$1,404,792 |
1404791.9526148 |
|
 Corey Hart
 |
Hart Corey |
PH |
$2,500,000 |
2500000 |
2.77% |
2.77 |
-0.41 |
-0.4097 |
— |
0 |
— |
0 |
|
 Jung Ho Kang
 |
Kang Jung Ho |
3B |
$2,500,000 |
2500000 |
2.77% |
2.77 |
3.61 |
3.60663 |
1.44 |
1.442652 |
$693,168 |
693167.86030172 |
|
 Vance Worley
 |
Worley Vance |
RP |
$2,450,000 |
2450000 |
2.71% |
2.71 |
0.43 |
0.43147 |
0.18 |
0.17611020408163 |
$5,678,263 |
5678262.6833847 |
|
 Sean Rodríguez
 |
Rodriguez Sean |
1B |
$1,900,000 |
1900000 |
2.10% |
2.10 |
-0.32 |
-0.321733 |
— |
0 |
— |
0 |
|
 Tony Watson
 |
Watson Tony |
RP |
$1,750,000 |
1750000 |
1.94% |
1.94 |
0.87 |
0.871268 |
0.50 |
0.49786742857143 |
$2,008,567 |
2008566.8244444 |
|
 Starling Marte
 |
Marte Starling |
LF |
$1,333,333 |
1333333 |
1.48% |
1.48 |
2.91 |
2.91389 |
2.19 |
2.1854180463545 |
$457,578 |
457578.35745344 |
|
 Chris Stewart
 |
Stewart Chris |
C |
$1,225,000 |
1225000 |
1.36% |
1.36 |
1.32 |
1.31744 |
1.08 |
1.0754612244898 |
$929,834 |
929833.6167112 |
|
 Jared Hughes
 |
Hughes Jared |
RP |
$1,075,000 |
1075000 |
1.19% |
1.19 |
-0.53 |
-0.525988 |
— |
0 |
— |
0 |
|
 Radhames Liz
 |
Liz Radhames |
RP |
$1,000,000 |
1000000 |
1.11% |
1.11 |
0.30 |
0.302631 |
0.30 |
0.302631 |
$3,304,354 |
3304354.1474601 |
|
 Francisco Cervelli
 |
Cervelli Francisco |
C |
$987,500 |
987500 |
1.09% |
1.09 |
6.21 |
6.2122 |
6.29 |
6.290835443038 |
$158,961 |
158961.39853836 |
|
 Jordy Mercer
 |
Mercer Jordy |
SS |
$538,000 |
538000 |
0.60% |
0.60 |
1.02 |
1.02027 |
1.90 |
1.8964126394052 |
$527,311 |
527311.39796328 |
|
 Gerrit Cole
 |
Cole Gerrit |
RP |
$531,000 |
531000 |
0.59% |
0.59 |
5.97 |
5.97213 |
11.25 |
11.246949152542 |
$88,913 |
88913.00088913 |
|
 Jeff Locke
 |
Locke Jeff |
RP |
$531,000 |
531000 |
0.59% |
0.59 |
0.86 |
0.857297 |
1.61 |
1.6144952919021 |
$619,389 |
619388.61328104 |
|
 Gregory Polanco
 |
Polanco Gregory |
RF |
$525,000 |
525000 |
0.58% |
0.58 |
3.24 |
3.23522 |
6.16 |
6.1623238095238 |
$162,276 |
162276.44487856 |
|
 Brandon Cumpton
 |
Cumpton Brandon |
DNP |
$520,500 |
520500 |
0.58% |
0.58 |
— |
0.00 |
— |
0 |
— |
0 |
|
 Justin Sellers
 |
Sellers Justin |
DNP |
$518,500 |
518500 |
0.57% |
0.57 |
— |
0.00 |
— |
0 |
— |
0 |
|
 Tony Sanchez
 |
Sanchez Tony |
C |
$518,000 |
518000 |
0.57% |
0.57 |
0.27 |
0.270582 |
0.52 |
0.52235907335907 |
$1,914,392 |
1914391.940336 |
|
 Rob Scahill
 |
Scahill Rob |
RP |
$517,500 |
517500 |
0.57% |
0.57 |
-0.05 |
-0.0536821 |
— |
0 |
— |
0 |
|
 Arquimedes Caminero
 |
Caminero Arquimedes |
RP |
$515,500 |
515500 |
0.57% |
0.57 |
0.58 |
0.581884 |
1.13 |
1.1287759456838 |
$885,915 |
885915.40581972 |
|
 Andrew Lambo
 |
Lambo Andrew |
PH |
$515,500 |
515500 |
0.57% |
0.57 |
-0.42 |
-0.418422 |
— |
0 |
— |
0 |
|
 Jaff Decker
 |
Decker Jaff |
PH |
$510,000 |
510000 |
0.56% |
0.56 |
0.07 |
0.0719926 |
0.14 |
0.14116196078431 |
$7,084,061 |
7084061.4174235 |
|
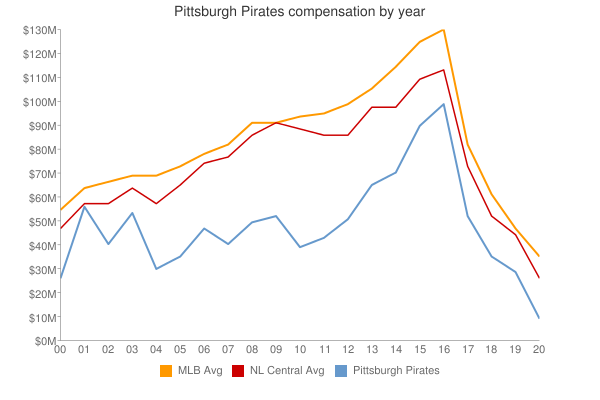
| Year | Pirates payroll |
PR Sort |
Avg payroll |
AvgPR Sort |
Diff |
Diff Sort |
|---|
| 2000 | $27,423,334 | 27423334 | $57,491,092 | 57491092 | $-30,067,758 | -30067758 |
| 2001 | $56,110,833 | 56110833 | $67,120,750 | 67120750 | $-11,009,917 | -11009917 |
| 2002 | $41,911,099 | 41911099 | $69,204,705 | 69204705 | $-27,293,606 | -27293606 |
| 2003 | $54,761,833 | 54761833 | $72,156,639 | 72156639 | $-17,394,806 | -17394806 |
| 2004 | $30,716,500 | 30716500 | $71,426,357 | 71426357 | $-40,709,857 | -40709857 |
| 2005 | $36,170,500 | 36170500 | $73,628,169 | 73628169 | $-37,457,669 | -37457669 |
| 2006 | $47,700,750 | 47700750 | $81,192,832 | 81192832 | $-33,492,082 | -33492082 |
| 2007 | $41,444,500 | 41444500 | $85,747,487 | 85747487 | $-44,302,987 | -44302987 |
| 2008 | $49,113,225 | 49113225 | $93,079,041 | 93079041 | $-43,965,816 | -43965816 |
| 2009 | $51,864,000 | 51864000 | $92,957,049 | 92957049 | $-41,093,049 | -41093049 |
| 2010 | $38,668,000 | 38668000 | $94,957,956 | 94957956 | $-56,289,956 | -56289956 |
| 2011 | $44,485,667 | 44485667 | $97,426,414 | 97426414 | $-52,940,747 | -52940747 |
| 2012 | $51,932,000 | 51932000 | $100,689,500 | 100689500 | $-48,757,500 | -48757500 |
| 2013 | $66,805,000 | 66805000 | $106,658,387 | 106658387 | $-39,853,387 | -39853387 |
| 2014 | $71,929,333 | 71929333 | $115,428,670 | 115428670 | $-43,499,337 | -43499337 |
| 2015 | $90,303,000 | 90303000 | $125,458,486 | 125458486 | $-35,155,486 | -35155486 |
| 2016 | $99,945,500 | 99945500 | $130,290,910 | 130290910 | $-30,345,410 | -30345410 |
| 2017 | $95,807,004 | 95807004 | $136,573,000 | 136573000 | $-40,765,996 | -40765996 |
| 2018 | $86,340,001 | 86340001 | $135,681,867 | 135681867 | $-49,341,866 | -49341866 |
| 2019 | $74,808,000 | 74808000 | $134,776,225 | 134776225 | $-59,968,225 | -59968225 |
| 2020 | $53,939,500 | 53939500 | $138,321,485 | 138321485 | $-84,381,985 | -84381985 |
| 2021 | $55,452,000 | 55452000 | $129,635,938 | 129635938 | $-74,183,938 | -74183938 |
| 2022 | $55,761,800 | 55761800 | $147,002,411 | 147002411 | $-91,240,611 | -91240611 |
| 2023 | $72,777,500 | 72777500 | $158,155,877 | 158155877 | $-85,378,377 | -85378377 |
| 2024 | $53,029,000 | 53029000 | $133,074,721 | 133074721 | $-80,045,721 | -80045721 |
| 2025 | $34,661,500 | 34661500 | $94,180,059 | 94180059 | $-59,518,559 | -59518559 |
| 2026 | $38,161,500 | 38161500 | $74,818,461 | 74818461 | $-36,656,961 | -36656961 |
| 2027 | $40,661,500 | 40661500 | $56,972,319 | 56972319 | $-16,310,819 | -16310819 |
| 2028 | $43,661,500 | 43661500 | $45,437,759 | 45437759 | $-1,776,259 | -1776259 |
| 2029 | $23,250,000 | 23250000 | $37,269,628 | 37269628 | $-14,019,628 | -14019628 |
| 2030 | $21,250,000 | 21250000 | $39,665,769 | 39665769 | $-18,415,769 | -18415769 |
| 2031 | $2,000,000 | 2000000 | $38,360,152 | 38360152 | $-36,360,152 | -36360152 |
|
 2015 Pittsburgh Pirates