| Player | Player Sort | Pos | Salary | Salary Sort | Pct | Pct Sort | WARP | WARP Sort | WARP/$M | WARP/$M Sort | $/WARP | $/WARP Sort | Current Status |
|---|
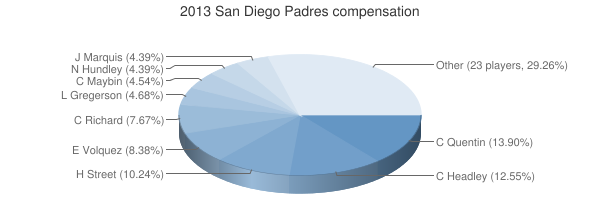
 Carlos Quentin
 |
Quentin Carlos |
LF |
$9,500,000 |
9500000 |
13.90% |
13.90 |
1.61 |
1.61041 |
0.17 |
0.16951684210526 |
$5,899,119 |
5899118.8579306 |
|
 Chase Headley
 |
Headley Chase |
3B |
$8,575,000 |
8575000 |
12.55% |
12.55 |
1.58 |
1.58302 |
0.18 |
0.18460874635569 |
$5,416,861 |
5416861.4420538 |
|
 Huston Street
 |
Street Huston |
RP |
$7,000,000 |
7000000 |
10.24% |
10.24 |
0.37 |
0.365493 |
0.05 |
0.052213285714286 |
$19,152,214 |
19152213.585486 |
|
 Edinson Vólquez
 |
Volquez Edinson |
RP |
$5,725,000 |
5725000 |
8.38% |
8.38 |
1.08 |
1.08138 |
0.19 |
0.18888733624454 |
$5,294,161 |
5294161.164438 |
|
 Clayton Richard
 |
Richard Clayton |
RP |
$5,240,000 |
5240000 |
7.67% |
7.67 |
-0.41 |
-0.406917 |
— |
0 |
— |
0 |
|
 Luke Gregerson
 |
Gregerson Luke |
RP |
$3,200,000 |
3200000 |
4.68% |
4.68 |
1.17 |
1.17001 |
0.37 |
0.365628125 |
$2,735,019 |
2735019.3588089 |
|
 Cameron Maybin
 |
Maybin Cameron |
CF |
$3,100,000 |
3100000 |
4.54% |
4.54 |
-0.44 |
-0.440164 |
— |
0 |
— |
0 |
|
 Nick Hundley
 |
Hundley Nick |
C |
$3,000,000 |
3000000 |
4.39% |
4.39 |
0.18 |
0.175748 |
0.06 |
0.058582666666667 |
$17,069,896 |
17069895.532239 |
|
 Jason Marquis
 |
Marquis Jason |
RP |
$3,000,000 |
3000000 |
4.39% |
4.39 |
-1.12 |
-1.11704 |
— |
0 |
— |
0 |
|
 Will Venable
 |
Venable Will |
RF |
$2,675,000 |
2675000 |
3.91% |
3.91 |
1.97 |
1.9654 |
0.73 |
0.73472897196262 |
$1,361,046 |
1361046.0974865 |
|
 Chris Denorfia
 |
Denorfia Chris |
RF |
$2,000,000 |
2000000 |
2.93% |
2.93 |
2.87 |
2.86524 |
1.43 |
1.43262 |
$698,022 |
698021.80620123 |
|
 Joe Thatcher
 |
Thatcher Joe |
RP |
$1,350,000 |
1350000 |
1.98% |
1.98 |
0.62 |
0.616181 |
0.46 |
0.45643037037037 |
$2,190,915 |
2190914.6825365 |
|
 Everth Cabrera
 |
Cabrera Everth |
SS |
$1,275,000 |
1275000 |
1.87% |
1.87 |
3.14 |
3.14045 |
2.46 |
2.4630980392157 |
$405,993 |
405992.77173653 |
|
 Mark Kotsay
 |
Kotsay Mark |
PH |
$1,250,000 |
1250000 |
1.83% |
1.83 |
-1.23 |
-1.22793 |
— |
0 |
— |
0 |
|
 Yasmani Grandal
 |
Grandal Yasmani |
C |
$1,240,000 |
1240000 |
1.81% |
1.81 |
1.33 |
1.33412 |
1.08 |
1.0759032258065 |
$929,452 |
929451.62354211 |
|
 Cory Luebke
 |
Luebke Cory |
DNP |
$1,125,000 |
1125000 |
1.65% |
1.65 |
— |
0.00 |
— |
0 |
— |
0 |
|
 Yonder Alonso
 |
Alonso Yonder |
1B |
$1,120,000 |
1120000 |
1.64% |
1.64 |
0.61 |
0.612244 |
0.55 |
0.54664642857143 |
$1,829,336 |
1829336.0163595 |
|
 John Baker
 |
Baker John |
C |
$930,000 |
930000 |
1.36% |
1.36 |
-0.27 |
-0.266972 |
— |
0 |
— |
0 |
|
 Cody Ransom
 |
Ransom Cody |
3B |
$550,000 |
550000 |
0.80% |
0.80 |
-0.23 |
-0.23464 |
— |
0 |
— |
0 |
|
 Eric Stults
 |
Stults Eric |
RP |
$507,600 |
507600 |
0.74% |
0.74 |
3.53 |
3.5327 |
6.96 |
6.9596138691883 |
$143,686 |
143686.13241996 |
|
 Anthony Bass
 |
Bass Anthony |
RP |
$503,600 |
503600 |
0.74% |
0.74 |
0.03 |
0.0313865 |
0.06 |
0.062324265289913 |
$16,045,115 |
16045114.937951 |
|
 Jesus Guzman
 |
Guzman Jesus |
PH |
$503,200 |
503200 |
0.74% |
0.74 |
-0.18 |
-0.182611 |
— |
0 |
— |
0 |
|
 Andrew Cashner
 |
Cashner Andrew |
RP |
$500,800 |
500800 |
0.73% |
0.73 |
4.20 |
4.20285 |
8.39 |
8.3922723642173 |
$119,157 |
119157.23854051 |
|
 Tyson Ross
 |
Ross Tyson |
RP |
$500,500 |
500500 |
0.73% |
0.73 |
2.21 |
2.20908 |
4.41 |
4.4137462537463 |
$226,565 |
226564.90484727 |
|
 Logan Forsythe
 |
Forsythe Logan |
2B |
$499,000 |
499000 |
0.73% |
0.73 |
0.12 |
0.123786 |
0.25 |
0.24806813627255 |
$4,031,151 |
4031150.5339861 |
|
 Dale Thayer
 |
Thayer Dale |
RP |
$498,900 |
498900 |
0.73% |
0.73 |
0.91 |
0.908878 |
1.82 |
1.8217638805372 |
$548,919 |
548918.55672599 |
|
 Brad Brach
 |
Brach Brad |
RP |
$498,200 |
498200 |
0.73% |
0.73 |
0.05 |
0.0493802 |
0.10 |
0.099117221999197 |
$10,089,064 |
10089064.037813 |
|
 Alexi Amarista
 |
Amarista Alexi |
CF |
$497,400 |
497400 |
0.73% |
0.73 |
0.40 |
0.396309 |
0.80 |
0.79676115802171 |
$1,255,081 |
1255081.2623483 |
|
 Joe Wieland
 |
Wieland Joe |
DNP |
$494,300 |
494300 |
0.72% |
0.72 |
— |
0.00 |
— |
0 |
— |
0 |
|
 James Darnell
 |
Darnell James |
DNP |
$493,700 |
493700 |
0.72% |
0.72 |
— |
0.00 |
— |
0 |
— |
0 |
|
 Casey Kelly
 |
Kelly Casey |
DNP |
$491,400 |
491400 |
0.72% |
0.72 |
— |
0.00 |
— |
0 |
— |
0 |
|
 Jedd Gyorko
 |
Gyorko Jedd |
2B |
$490,000 |
490000 |
0.72% |
0.72 |
1.35 |
1.34835 |
2.75 |
2.7517346938776 |
$363,407 |
363407.12722958 |
|
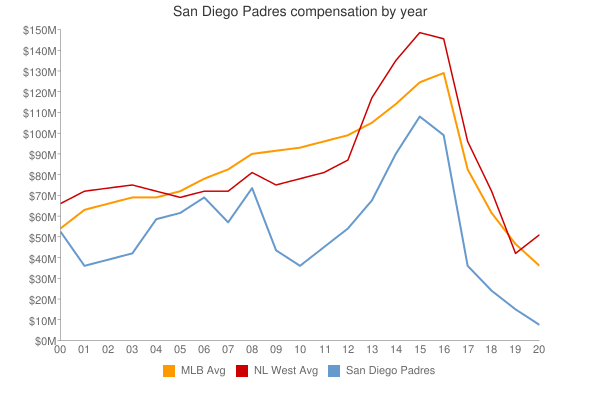
| Year | Padres payroll |
PR Sort |
Avg payroll |
AvgPR Sort |
Diff |
Diff Sort |
|---|
| 1996 | $2,000,000 | 2000000 | $4,583,416 | 4583416 | $-2,583,416 | -2583416 |
| 1997 | $2,000,000 | 2000000 | $4,892,222 | 4892222 | $-2,892,222 | -2892222 |
| 2000 | $53,816,000 | 53816000 | $57,491,092 | 57491092 | $-3,675,092 | -3675092 |
| 2001 | $37,438,000 | 37438000 | $67,120,750 | 67120750 | $-29,682,750 | -29682750 |
| 2002 | $40,678,000 | 40678000 | $69,204,705 | 69204705 | $-28,526,705 | -28526705 |
| 2003 | $43,565,000 | 43565000 | $72,156,639 | 72156639 | $-28,591,639 | -28591639 |
| 2004 | $59,172,333 | 59172333 | $71,426,357 | 71426357 | $-12,254,024 | -12254024 |
| 2005 | $62,186,333 | 62186333 | $73,628,169 | 73628169 | $-11,441,836 | -11441836 |
| 2006 | $69,170,167 | 69170167 | $81,192,832 | 81192832 | $-12,022,665 | -12022665 |
| 2007 | $58,571,067 | 58571067 | $85,747,487 | 85747487 | $-27,176,420 | -27176420 |
| 2008 | $74,010,117 | 74010117 | $93,079,041 | 93079041 | $-19,068,924 | -19068924 |
| 2009 | $44,173,200 | 44173200 | $92,957,049 | 92957049 | $-48,783,849 | -48783849 |
| 2010 | $37,799,300 | 37799300 | $94,957,956 | 94957956 | $-57,158,656 | -57158656 |
| 2011 | $45,869,140 | 45869140 | $97,426,414 | 97426414 | $-51,557,274 | -51557274 |
| 2012 | $55,621,900 | 55621900 | $100,689,500 | 100689500 | $-45,067,600 | -45067600 |
| 2013 | $68,333,600 | 68333600 | $106,658,387 | 106658387 | $-38,324,787 | -38324787 |
| 2014 | $90,636,600 | 90636600 | $115,428,670 | 115428670 | $-24,792,070 | -24792070 |
| 2015 | $108,387,033 | 108387033 | $125,458,486 | 125458486 | $-17,071,453 | -17071453 |
| 2016 | $100,509,500 | 100509500 | $130,290,910 | 130290910 | $-29,781,410 | -29781410 |
| 2017 | $67,624,400 | 67624400 | $136,573,000 | 136573000 | $-68,948,600 | -68948600 |
| 2018 | $94,037,733 | 94037733 | $135,681,867 | 135681867 | $-41,644,134 | -41644134 |
| 2019 | $100,804,100 | 100804100 | $134,776,225 | 134776225 | $-33,972,125 | -33972125 |
| 2020 | $151,461,550 | 151461550 | $138,321,485 | 138321485 | $13,140,065 | 13140065 |
| 2021 | $171,488,220 | 171488220 | $129,635,938 | 129635938 | $41,852,282 | 41852282 |
| 2022 | $212,846,719 | 212846719 | $147,002,411 | 147002411 | $65,844,308 | 65844308 |
| 2023 | $221,599,740 | 221599740 | $158,155,877 | 158155877 | $63,443,863 | 63443863 |
| 2024 | $153,892,054 | 153892054 | $133,074,721 | 133074721 | $20,817,333 | 20817333 |
| 2025 | $150,295,454 | 150295454 | $94,180,059 | 94180059 | $56,115,395 | 56115395 |
| 2026 | $137,745,454 | 137745454 | $74,818,461 | 74818461 | $62,926,993 | 62926993 |
| 2027 | $156,495,454 | 156495454 | $56,972,319 | 56972319 | $99,523,135 | 99523135 |
| 2028 | $124,545,454 | 124545454 | $45,437,759 | 45437759 | $79,107,695 | 79107695 |
| 2029 | $113,545,454 | 113545454 | $37,269,628 | 37269628 | $76,275,826 | 76275826 |
| 2030 | $113,545,454 | 113545454 | $39,665,769 | 39665769 | $73,879,685 | 73879685 |
| 2031 | $101,259,739 | 101259739 | $38,360,152 | 38360152 | $62,899,587 | 62899587 |
| 2032 | $101,259,739 | 101259739 | $47,925,459 | 47925459 | $53,334,280 | 53334280 |
| 2033 | $101,259,739 | 101259739 | $43,068,924 | 43068924 | $58,190,815 | 58190815 |
| 2034 | $36,714,285 | 36714285 | $29,428,571 | 29428571 | $7,285,714 | 7285714 |
|
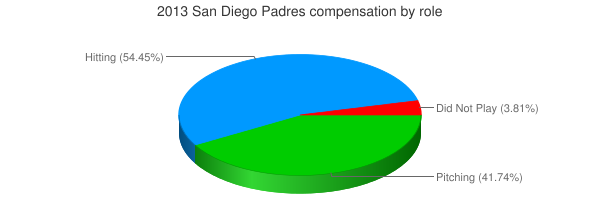
 2013 San Diego Padres