| Player | Player Sort | Pos | Salary | Salary Sort | Pct | Pct Sort | WARP | WARP Sort | WARP/$M | WARP/$M Sort | $/WARP | $/WARP Sort | Current Status |
|---|
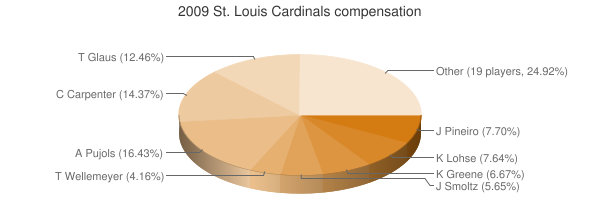
 Albert Pujols
 |
Pujols Albert |
1B |
$16,000,000 |
16000000 |
16.62% |
16.62 |
12.79 |
12.7935 |
0.80 |
0.79959375 |
$1,250,635 |
1250635.0881307 |
|
 Chris Carpenter
 |
Carpenter Chris |
RP |
$14,000,000 |
14000000 |
14.54% |
14.54 |
6.27 |
6.27013 |
0.45 |
0.44786642857143 |
$2,232,809 |
2232808.5701572 |
|
 Troy Glaus
 |
Glaus Troy |
3B |
$12,137,000 |
12137000 |
12.60% |
12.60 |
-0.23 |
-0.234403 |
— |
0 |
— |
0 |
|
 Joel Pineiro
 |
Pineiro Joel |
RP |
$7,500,000 |
7500000 |
7.79% |
7.79 |
4.84 |
4.83649 |
0.64 |
0.64486533333333 |
$1,550,711 |
1550711.3629926 |
|
 Kyle Lohse
 |
Lohse Kyle |
RP |
$7,437,500 |
7437500 |
7.72% |
7.72 |
2.19 |
2.19221 |
0.29 |
0.29475092436975 |
$3,392,695 |
3392695.0429019 |
|
 Khalil Greene
 |
Greene Khalil |
PH |
$6,500,000 |
6500000 |
6.75% |
6.75 |
-0.06 |
-0.0568751 |
— |
0 |
— |
0 |
|
 Todd Wellemeyer
 |
Wellemeyer Todd |
RP |
$4,050,000 |
4050000 |
4.21% |
4.21 |
-1.40 |
-1.40132 |
— |
0 |
— |
0 |
|
 Adam Kennedy
 |
Kennedy Adam |
DNP |
$4,000,000 |
4000000 |
4.15% |
4.15 |
— |
0.00 |
— |
0 |
— |
0 |
|
 Ryan Ludwick
 |
Ludwick Ryan |
RF |
$3,700,000 |
3700000 |
3.84% |
3.84 |
2.72 |
2.72435 |
0.74 |
0.73631081081081 |
$1,358,122 |
1358122.1208729 |
|
 Yadier Molina
 |
Molina Yadier |
C |
$3,312,500 |
3312500 |
3.44% |
3.44 |
4.63 |
4.63018 |
1.40 |
1.3977901886792 |
$715,415 |
715414.95147057 |
|
 Rick Ankiel
 |
Ankiel Rick |
CF |
$2,825,000 |
2825000 |
2.93% |
2.93 |
0.95 |
0.953001 |
0.34 |
0.33734548672566 |
$2,964,320 |
2964320.0794123 |
|
 Adam Wainwright
 |
Wainwright Adam |
RP |
$2,787,500 |
2787500 |
2.89% |
2.89 |
7.64 |
7.63692 |
2.74 |
2.7397022421525 |
$365,003 |
365003.16881675 |
|
 Ryan Franklin
 |
Franklin Ryan |
RP |
$2,500,000 |
2500000 |
2.60% |
2.60 |
0.82 |
0.821918 |
0.33 |
0.3287672 |
$3,041,666 |
3041665.9569446 |
|
 Trever Miller
 |
Miller Trever |
RP |
$2,000,000 |
2000000 |
2.08% |
2.08 |
0.56 |
0.562675 |
0.28 |
0.2813375 |
$3,554,450 |
3554449.7267517 |
|
 Dennys Reyes
 |
Reyes Dennys |
RP |
$1,000,000 |
1000000 |
1.04% |
1.04 |
-0.01 |
-0.0145383 |
— |
0 |
— |
0 |
|
 Jason LaRue
 |
LaRue Jason |
C |
$950,000 |
950000 |
0.99% |
0.99 |
-0.02 |
-0.0180878 |
— |
0 |
— |
0 |
|
 Chris Duncan
 |
Duncan Chris |
LF |
$825,000 |
825000 |
0.86% |
0.86 |
-0.66 |
-0.655416 |
— |
0 |
— |
0 |
|
 Brad Thompson
 |
Thompson Brad |
RP |
$650,000 |
650000 |
0.67% |
0.67 |
0.36 |
0.355647 |
0.55 |
0.54714923076923 |
$1,827,655 |
1827654.9499925 |
|
 Joe Thurston
 |
Thurston Joe |
3B |
$475,000 |
475000 |
0.49% |
0.49 |
-0.11 |
-0.107751 |
— |
0 |
— |
0 |
|
 Skip Schumaker
 |
Schumaker Skip |
2B |
$430,000 |
430000 |
0.45% |
0.45 |
1.92 |
1.91601 |
4.46 |
4.4558372093023 |
$224,425 |
224424.71594616 |
|
 Kyle McClellan
 |
McClellan Kyle |
RP |
$411,000 |
411000 |
0.43% |
0.43 |
0.62 |
0.616933 |
1.50 |
1.5010535279805 |
$666,199 |
666198.76064338 |
|
 Josh Kinney
 |
Kinney Josh |
RP |
$405,000 |
405000 |
0.42% |
0.42 |
-0.35 |
-0.347404 |
— |
0 |
— |
0 |
|
 Brendan Ryan
 |
Ryan Brendan |
SS |
$403,000 |
403000 |
0.42% |
0.42 |
4.89 |
4.89287 |
12.14 |
12.14111662531 |
$82,365 |
82364.747070738 |
|
 Jason Motte
 |
Motte Jason |
RP |
$400,000 |
400000 |
0.42% |
0.42 |
0.46 |
0.461269 |
1.15 |
1.1531725 |
$867,173 |
867172.95114131 |
|
 Colby Rasmus
 |
Rasmus Colby |
CF |
$400,000 |
400000 |
0.42% |
0.42 |
1.89 |
1.89471 |
4.74 |
4.736775 |
$211,114 |
211114.10189422 |
|
 Jaime García
 |
Garcia Jaime |
DNP |
$400,000 |
400000 |
0.42% |
0.42 |
— |
0.00 |
— |
0 |
— |
0 |
|
 David Freese
 |
Freese David |
PH |
$400,000 |
400000 |
0.42% |
0.42 |
0.22 |
0.223699 |
0.56 |
0.5592475 |
$1,788,117 |
1788117.0680244 |
|
 Brian Barden
 |
Barden Brian |
3B |
$400,000 |
400000 |
0.42% |
0.42 |
0.38 |
0.382014 |
0.96 |
0.955035 |
$1,047,082 |
1047082.0441136 |
|
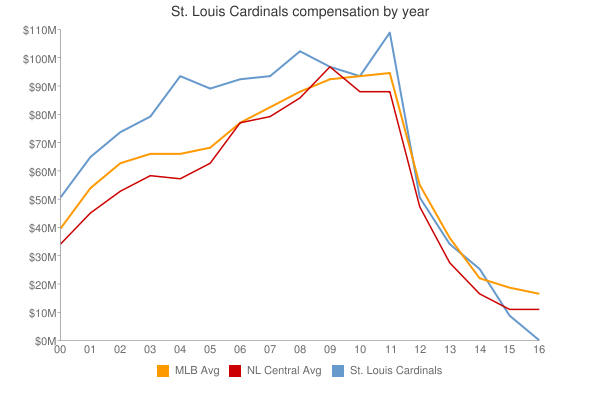
| Year | Cardinals payroll |
PR Sort |
Avg payroll |
AvgPR Sort |
Diff |
Diff Sort |
|---|
| 1977 | $60,000 | 60000 | $60,000 | 60000 | $0 | 0 |
| 1979 | $75,000 | 75000 | $48,000 | 48000 | $27,000 | 27000 |
| 2000 | $62,093,023 | 62093023 | $56,164,089 | 56164089 | $5,928,934 | 5928934 |
| 2001 | $76,903,333 | 76903333 | $65,991,638 | 65991638 | $10,911,695 | 10911695 |
| 2002 | $74,425,875 | 74425875 | $68,244,471 | 68244471 | $6,181,404 | 6181404 |
| 2003 | $81,365,000 | 81365000 | $71,318,479 | 71318479 | $10,046,521 | 10046521 |
| 2004 | $81,895,000 | 81895000 | $70,466,961 | 70466961 | $11,428,039 | 11428039 |
| 2005 | $90,948,500 | 90948500 | $73,264,780 | 73264780 | $17,683,720 | 17683720 |
| 2006 | $89,093,658 | 89093658 | $79,051,754 | 79051754 | $10,041,904 | 10041904 |
| 2007 | $94,366,000 | 94366000 | $83,931,138 | 83931138 | $10,434,862 | 10434862 |
| 2008 | $99,865,500 | 99865500 | $90,812,373 | 90812373 | $9,053,127 | 9053127 |
| 2009 | $96,298,500 | 96298500 | $91,093,211 | 91093211 | $5,205,289 | 5205289 |
| 2010 | $94,220,500 | 94220500 | $93,373,681 | 93373681 | $846,819 | 846819 |
| 2011 | $109,098,000 | 109098000 | $96,102,034 | 96102034 | $12,995,966 | 12995966 |
| 2012 | $111,858,500 | 111858500 | $100,657,138 | 100657138 | $11,201,362 | 11201362 |
| 2013 | $116,505,000 | 116505000 | $109,024,990 | 109024990 | $7,480,010 | 7480010 |
| 2014 | $111,250,000 | 111250000 | $117,828,782 | 117828782 | $-6,578,782 | -6578782 |
| 2015 | $122,066,500 | 122066500 | $127,404,244 | 127404244 | $-5,337,744 | -5337744 |
| 2016 | $145,553,500 | 145553500 | $132,219,407 | 132219407 | $13,334,093 | 13334093 |
| 2017 | $150,152,933 | 150152933 | $137,302,894 | 137302894 | $12,850,039 | 12850039 |
| 2018 | $159,698,667 | 159698667 | $136,929,168 | 136929168 | $22,769,499 | 22769499 |
| 2019 | $162,620,267 | 162620267 | $136,944,257 | 136944257 | $25,676,010 | 25676010 |
| 2020 | $166,101,500 | 166101500 | $140,677,788 | 140677788 | $25,423,712 | 25423712 |
| 2021 | $156,459,167 | 156459167 | $132,162,631 | 132162631 | $24,296,536 | 24296536 |
| 2022 | $140,285,316 | 140285316 | $149,374,046 | 149374046 | $-9,088,730 | -9088730 |
| 2023 | $180,440,183 | 180440183 | $160,460,390 | 160460390 | $19,979,793 | 19979793 |
| 2024 | $155,916,667 | 155916667 | $135,504,022 | 135504022 | $20,412,645 | 20412645 |
| 2025 | $113,906,667 | 113906667 | $96,417,302 | 96417302 | $17,489,365 | 17489365 |
| 2026 | $75,000,000 | 75000000 | $76,694,120 | 76694120 | $-1,694,120 | -1694120 |
| 2027 | $38,500,000 | 38500000 | $58,935,617 | 58935617 | $-20,435,617 | -20435617 |
| 2028 | $5,000,000 | 5000000 | $45,437,759 | 45437759 | $-40,437,759 | -40437759 |
|
 2009 St. Louis Cardinals