| Player | Player Sort | Pos | Salary | Salary Sort | Pct | Pct Sort | WARP | WARP Sort | WARP/$M | WARP/$M Sort | $/WARP | $/WARP Sort | Current Status |
|---|
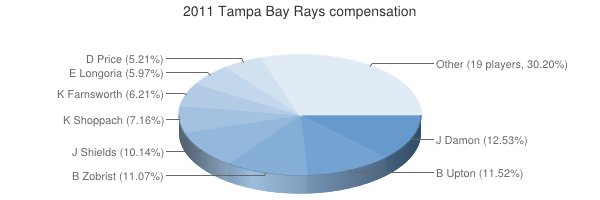
 Johnny Damon
 |
Damon Johnny |
DH |
$5,250,000 |
5250000 |
12.53% |
12.53 |
1.80 |
1.80365 |
0.34 |
0.34355238095238 |
$2,910,764 |
2910764.2835362 |
|
 B.J. Upton
 |
Upton B.J. |
CF |
$4,825,000 |
4825000 |
11.52% |
11.52 |
3.33 |
3.32659 |
0.69 |
0.68944870466321 |
$1,450,434 |
1450434.2284441 |
|
 Ben Zobrist
 |
Zobrist Ben |
2B |
$4,640,475 |
4640475 |
11.07% |
11.07 |
3.86 |
3.86456 |
0.83 |
0.83279405664291 |
$1,200,777 |
1200777.0612955 |
|
 James Shields
 |
Shields James |
RP |
$4,250,000 |
4250000 |
10.14% |
10.14 |
4.67 |
4.66677 |
1.10 |
1.0980635294118 |
$910,694 |
910694.12034448 |
|
 Kelly Shoppach
 |
Shoppach Kelly |
C |
$3,000,000 |
3000000 |
7.16% |
7.16 |
-0.16 |
-0.159412 |
— |
0 |
— |
0 |
|
 Kyle Farnsworth
 |
Farnsworth Kyle |
RP |
$2,600,000 |
2600000 |
6.21% |
6.21 |
0.91 |
0.908216 |
0.35 |
0.34931384615385 |
$2,862,755 |
2862755.1155232 |
|
 Evan Longoria
 |
Longoria Evan |
3B |
$2,500,000 |
2500000 |
5.97% |
5.97 |
6.11 |
6.11245 |
2.44 |
2.44498 |
$409,001 |
409001.30062414 |
|
 David Price
 |
Price David |
RP |
$2,183,333 |
2183333 |
5.21% |
5.21 |
4.16 |
4.15797 |
1.90 |
1.9044140312082 |
$525,096 |
525095.90016282 |
|
 J.P. Howell
 |
Howell J.P. |
RP |
$1,100,000 |
1100000 |
2.63% |
2.63 |
-0.14 |
-0.139173 |
— |
0 |
— |
0 |
|
 Dan Johnson
 |
Johnson Dan |
1B |
$1,000,000 |
1000000 |
2.39% |
2.39 |
-0.87 |
-0.872275 |
— |
0 |
— |
0 |
|
 Felipe Lopez
 |
Lopez Felipe |
3B |
$1,000,000 |
1000000 |
2.39% |
2.39 |
-0.36 |
-0.364001 |
— |
0 |
— |
0 |
|
 Wade Davis
 |
Davis Wade |
RP |
$1,000,000 |
1000000 |
2.39% |
2.39 |
-0.20 |
-0.203732 |
— |
0 |
— |
0 |
|
 Joel Peralta
 |
Peralta Joel |
RP |
$925,000 |
925000 |
2.21% |
2.21 |
1.17 |
1.1677 |
1.26 |
1.2623783783784 |
$792,156 |
792155.51939711 |
|
 Andy Sonnanstine
 |
Sonnanstine Andy |
RP |
$912,500 |
912500 |
2.18% |
2.18 |
0.23 |
0.231127 |
0.25 |
0.2532898630137 |
$3,948,046 |
3948045.8795381 |
|
 Jeff Niemann
 |
Niemann Jeff |
RP |
$903,000 |
903000 |
2.16% |
2.16 |
1.40 |
1.40033 |
1.55 |
1.5507530454042 |
$644,848 |
644848.00011426 |
|
 Juan Cruz
 |
Cruz Juan |
RP |
$850,000 |
850000 |
2.03% |
2.03 |
0.40 |
0.396852 |
0.47 |
0.46688470588235 |
$2,141,856 |
2141856.4099463 |
|
 Casey Kotchman
 |
Kotchman Casey |
1B |
$750,000 |
750000 |
1.79% |
1.79 |
1.91 |
1.91481 |
2.55 |
2.55308 |
$391,684 |
391683.7701913 |
|
 Sean Rodríguez
 |
Rodriguez Sean |
SS |
$428,600 |
428600 |
1.02% |
1.02 |
1.14 |
1.14194 |
2.66 |
2.6643490433971 |
$375,326 |
375326.19927492 |
|
 John Jaso
 |
Jaso John |
C |
$427,200 |
427200 |
1.02% |
1.02 |
-0.57 |
-0.57429 |
— |
0 |
— |
0 |
|
 Matt Joyce
 |
Joyce Matt |
RF |
$426,500 |
426500 |
1.02% |
1.02 |
2.79 |
2.79374 |
6.55 |
6.550386869871 |
$152,663 |
152662.73883754 |
|
 Reid Brignac
 |
Brignac Reid |
SS |
$425,400 |
425400 |
1.02% |
1.02 |
-0.58 |
-0.583336 |
— |
0 |
— |
0 |
|
 Adam Russell
 |
Russell Adam |
RP |
$420,800 |
420800 |
1.00% |
1.00 |
-0.65 |
-0.650734 |
— |
0 |
— |
0 |
|
 Jeremy Hellickson
 |
Hellickson Jeremy |
RP |
$418,400 |
418400 |
1.00% |
1.00 |
1.57 |
1.56931 |
3.75 |
3.750740917782 |
$266,614 |
266613.98958778 |
|
 Sam Fuld
 |
Fuld Sam |
LF |
$418,300 |
418300 |
1.00% |
1.00 |
1.71 |
1.70683 |
4.08 |
4.0803968443701 |
$245,074 |
245074.20188302 |
|
 César Ramos
 |
Ramos Cesar |
RP |
$416,700 |
416700 |
0.99% |
0.99 |
-0.44 |
-0.443434 |
— |
0 |
— |
0 |
|
 Jake McGee
 |
McGee Jake |
RP |
$415,200 |
415200 |
0.99% |
0.99 |
-0.11 |
-0.10548 |
— |
0 |
— |
0 |
|
 Elliot Johnson
 |
Johnson Elliot |
SS |
$414,900 |
414900 |
0.99% |
0.99 |
-0.34 |
-0.340457 |
— |
0 |
— |
0 |
|
| Year | Rays payroll |
PR Sort |
Avg payroll |
AvgPR Sort |
Diff |
Diff Sort |
|---|
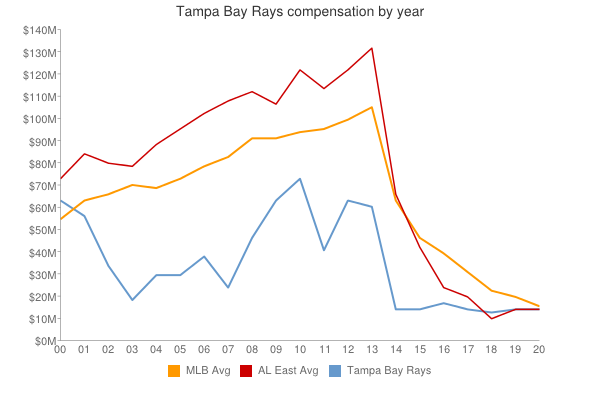
| 2000 | $62,815,129 | 62815129 | $56,164,089 | 56164089 | $6,651,040 | 6651040 |
| 2001 | $56,725,000 | 56725000 | $65,991,638 | 65991638 | $-9,266,638 | -9266638 |
| 2002 | $34,380,000 | 34380000 | $68,244,471 | 68244471 | $-33,864,471 | -33864471 |
| 2003 | $19,130,000 | 19130000 | $71,318,479 | 71318479 | $-52,188,479 | -52188479 |
| 2004 | $29,754,167 | 29754167 | $70,466,961 | 70466961 | $-40,712,794 | -40712794 |
| 2005 | $30,445,567 | 30445567 | $73,264,780 | 73264780 | $-42,819,213 | -42819213 |
| 2006 | $38,319,967 | 38319967 | $79,051,754 | 79051754 | $-40,731,787 | -40731787 |
| 2007 | $25,790,800 | 25790800 | $83,931,138 | 83931138 | $-58,140,338 | -58140338 |
| 2008 | $47,124,500 | 47124500 | $90,812,373 | 90812373 | $-43,687,873 | -43687873 |
| 2009 | $65,401,368 | 65401368 | $91,093,211 | 91093211 | $-25,691,843 | -25691843 |
| 2010 | $74,487,608 | 74487608 | $93,373,681 | 93373681 | $-18,886,073 | -18886073 |
| 2011 | $41,901,308 | 41901308 | $96,102,034 | 96102034 | $-54,200,726 | -54200726 |
| 2012 | $63,626,675 | 63626675 | $100,657,138 | 100657138 | $-37,030,463 | -37030463 |
| 2013 | $61,928,975 | 61928975 | $109,024,990 | 109024990 | $-47,096,015 | -47096015 |
| 2014 | $76,872,383 | 76872383 | $117,828,782 | 117828782 | $-40,956,399 | -40956399 |
| 2015 | $77,294,234 | 77294234 | $127,404,244 | 127404244 | $-50,110,010 | -50110010 |
| 2016 | $66,681,991 | 66681991 | $132,219,407 | 132219407 | $-65,537,416 | -65537416 |
| 2017 | $70,612,800 | 70612800 | $137,302,894 | 137302894 | $-66,690,094 | -66690094 |
| 2018 | $76,007,496 | 76007496 | $136,929,168 | 136929168 | $-60,921,672 | -60921672 |
| 2019 | $60,084,133 | 60084133 | $136,944,257 | 136944257 | $-76,860,124 | -76860124 |
| 2020 | $69,303,833 | 69303833 | $140,677,788 | 140677788 | $-71,373,955 | -71373955 |
| 2021 | $63,714,834 | 63714834 | $132,162,631 | 132162631 | $-68,447,797 | -68447797 |
| 2022 | $85,728,178 | 85728178 | $149,374,046 | 149374046 | $-63,645,868 | -63645868 |
| 2023 | $73,184,811 | 73184811 | $160,460,390 | 160460390 | $-87,275,579 | -87275579 |
| 2024 | $56,128,512 | 56128512 | $135,504,022 | 135504022 | $-79,375,510 | -79375510 |
| 2025 | $51,971,212 | 51971212 | $96,417,302 | 96417302 | $-44,446,090 | -44446090 |
| 2026 | $26,954,545 | 26954545 | $76,694,120 | 76694120 | $-49,739,575 | -49739575 |
| 2027 | $23,204,545 | 23204545 | $58,935,617 | 58935617 | $-35,731,072 | -35731072 |
| 2028 | $25,454,546 | 25454546 | $45,437,759 | 45437759 | $-19,983,213 | -19983213 |
| 2029 | $25,454,546 | 25454546 | $37,269,628 | 37269628 | $-11,815,082 | -11815082 |
| 2030 | $25,454,546 | 25454546 | $39,665,769 | 39665769 | $-14,211,223 | -14211223 |
| 2031 | $25,454,546 | 25454546 | $38,360,152 | 38360152 | $-12,905,606 | -12905606 |
| 2032 | $25,454,546 | 25454546 | $47,925,459 | 47925459 | $-22,470,913 | -22470913 |
| 2033 | $2,000,000 | 2000000 | $43,068,924 | 43068924 | $-41,068,924 | -41068924 |
|
 2011 Tampa Bay Rays