| Player | Player Sort | Pos | Salary | Salary Sort | Pct | Pct Sort | WARP | WARP Sort | WARP/$M | WARP/$M Sort | $/WARP | $/WARP Sort | Current Status |
|---|
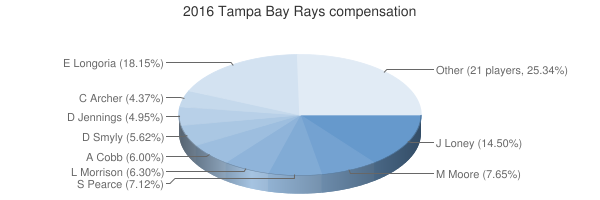
 Evan Longoria
 |
Longoria Evan |
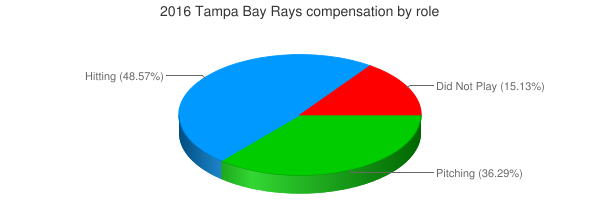
3B |
$12,100,000 |
12100000 |
18.15% |
18.15 |
3.35 |
3.34508 |
0.28 |
0.27645289256198 |
$3,617,253 |
3617252.8011288 |
|
 James Loney
 |
Loney James |
DNP |
$9,666,667 |
9666667 |
14.50% |
14.50 |
— |
0.00 |
— |
0 |
— |
0 |
|
 Matt Moore
 |
Moore Matt |
SP |
$5,100,000 |
5100000 |
7.65% |
7.65 |
1.16 |
1.15917 |
0.23 |
0.22728823529412 |
$4,399,700 |
4399699.7851911 |
|
 Steve Pearce
 |
Pearce Steve |
1B |
$4,750,000 |
4750000 |
7.12% |
7.12 |
1.98 |
1.98146 |
0.42 |
0.41714947368421 |
$2,397,222 |
2397222.2502599 |
|
 Logan Morrison
 |
Morrison Logan |
1B |
$4,200,000 |
4200000 |
6.30% |
6.30 |
0.16 |
0.155475 |
0.04 |
0.037017857142857 |
$27,013,989 |
27013989.387361 |
|
 Alex Cobb
 |
Cobb Alex |
SP |
$4,000,000 |
4000000 |
6.00% |
6.00 |
0.20 |
0.201114 |
0.05 |
0.0502785 |
$19,889,217 |
19889217.06097 |
|
 Drew Smyly
 |
Smyly Drew |
SP |
$3,750,000 |
3750000 |
5.62% |
5.62 |
1.53 |
1.52631 |
0.41 |
0.407016 |
$2,456,906 |
2456905.8710223 |
|
 Desmond Jennings
 |
Jennings Desmond |
LF |
$3,300,000 |
3300000 |
4.95% |
4.95 |
-0.46 |
-0.45549 |
— |
0 |
— |
0 |
|
 Chris Archer
 |
Archer Chris |
SP |
$2,916,667 |
2916667 |
4.37% |
4.37 |
4.39 |
4.385 |
1.50 |
1.5034283996082 |
$665,146 |
665146.40820981 |
|
 Erasmo Ramírez
 |
Ramirez Erasmo |
RP |
$2,375,000 |
2375000 |
3.56% |
3.56 |
0.53 |
0.53147 |
0.22 |
0.22377684210526 |
$4,468,738 |
4468737.6521723 |
|
 Logan Forsythe
 |
Forsythe Logan |
2B |
$2,250,000 |
2250000 |
3.37% |
3.37 |
1.44 |
1.44117 |
0.64 |
0.64052 |
$1,561,231 |
1561231.4994067 |
|
 Hank Conger
 |
Conger Hank |
C |
$1,500,000 |
1500000 |
2.25% |
2.25 |
-0.14 |
-0.144276 |
— |
0 |
— |
0 |
|
 Brandon Guyer
 |
Guyer Brandon |
LF |
$1,185,000 |
1185000 |
1.78% |
1.78 |
0.74 |
0.742168 |
0.63 |
0.62630210970464 |
$1,596,674 |
1596673.5294435 |
|
 Ryan Webb
 |
Webb Ryan |
RP |
$1,000,000 |
1000000 |
1.50% |
1.50 |
0.01 |
0.00779636 |
0.01 |
0.00779636 |
$128,264,985 |
128264985.19822 |
|
 Dana Eveland
 |
Eveland Dana |
RP |
$895,000 |
895000 |
1.34% |
1.34 |
-0.66 |
-0.660201 |
— |
0 |
— |
0 |
|
 Brad Miller
 |
Miller Brad |
SS |
$527,600 |
527600 |
0.79% |
0.79 |
2.21 |
2.20825 |
4.19 |
4.1854624715694 |
$238,922 |
238922.22348013 |
|
 Danny Farquhar
 |
Farquhar Danny |
RP |
$527,000 |
527000 |
0.79% |
0.79 |
0.82 |
0.822033 |
1.56 |
1.559834914611 |
$641,093 |
641093.48408154 |
|
 Chase Whitley
 |
Whitley Chase |
RP |
$524,525 |
524525 |
0.79% |
0.79 |
0.17 |
0.171572 |
0.33 |
0.32709975692293 |
$3,057,171 |
3057171.3333178 |
|
 Xavier Cedeño
 |
Cedeno Xavier |
RP |
$524,100 |
524100 |
0.79% |
0.79 |
1.35 |
1.34749 |
2.57 |
2.5710551421484 |
$388,945 |
388945.3725074 |
|
 Corey Dickerson
 |
Dickerson Corey |
LF |
$522,900 |
522900 |
0.78% |
0.78 |
0.97 |
0.971405 |
1.86 |
1.8577261426659 |
$538,292 |
538292.47327325 |
|
 Alex Colomé
 |
Colome Alex |
RP |
$521,700 |
521700 |
0.78% |
0.78 |
1.38 |
1.38052 |
2.65 |
2.6461951313015 |
$377,901 |
377901.08075218 |
|
 Jake Odorizzi
 |
Odorizzi Jake |
SP |
$520,700 |
520700 |
0.78% |
0.78 |
0.83 |
0.831851 |
1.60 |
1.5975628961014 |
$625,953 |
625953.44598973 |
|
 Steve Geltz
 |
Geltz Steve |
RP |
$519,300 |
519300 |
0.78% |
0.78 |
-0.69 |
-0.691448 |
— |
0 |
— |
0 |
|
 Brad Boxberger
 |
Boxberger Brad |
RP |
$519,200 |
519200 |
0.78% |
0.78 |
-0.33 |
-0.333908 |
— |
0 |
— |
0 |
|
 Steven Souza Jr.
 |
Souza Steven |
RF |
$516,100 |
516100 |
0.77% |
0.77 |
0.37 |
0.374966 |
0.73 |
0.72653749273397 |
$1,376,391 |
1376391.4594923 |
|
 Tim Beckham
 |
Beckham Tim |
SS |
$514,500 |
514500 |
0.77% |
0.77 |
0.50 |
0.497184 |
0.97 |
0.96634402332362 |
$1,034,828 |
1034828.1521529 |
|
 Kevin Kiermaier
 |
Kiermaier Kevin |
CF |
$514,400 |
514400 |
0.77% |
0.77 |
3.04 |
3.04433 |
5.92 |
5.9182153965785 |
$168,970 |
168969.85543617 |
|
 Curt Casali
 |
Casali Curt |
C |
$513,600 |
513600 |
0.77% |
0.77 |
0.39 |
0.386446 |
0.75 |
0.75242601246106 |
$1,329,034 |
1329034.3282114 |
|
 Enny Romero
 |
Romero Enny |
RP |
$510,000 |
510000 |
0.76% |
0.76 |
0.12 |
0.117026 |
0.23 |
0.22946274509804 |
$4,358,006 |
4358005.9132159 |
|
 René Rivera
 |
Rivera Rene |
DNP |
$418,032 |
418032 |
0.63% |
0.63 |
— |
0.00 |
— |
0 |
— |
0 |
|
| Year | Rays payroll |
PR Sort |
Avg payroll |
AvgPR Sort |
Diff |
Diff Sort |
|---|
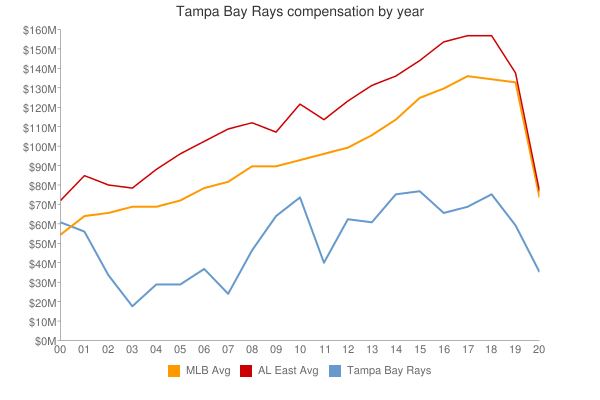
| 2000 | $62,815,129 | 62815129 | $57,491,092 | 57491092 | $5,324,037 | 5324037 |
| 2001 | $56,725,000 | 56725000 | $67,120,750 | 67120750 | $-10,395,750 | -10395750 |
| 2002 | $34,380,000 | 34380000 | $69,204,705 | 69204705 | $-34,824,705 | -34824705 |
| 2003 | $19,130,000 | 19130000 | $72,156,639 | 72156639 | $-53,026,639 | -53026639 |
| 2004 | $29,754,167 | 29754167 | $71,426,357 | 71426357 | $-41,672,190 | -41672190 |
| 2005 | $30,445,567 | 30445567 | $73,628,169 | 73628169 | $-43,182,602 | -43182602 |
| 2006 | $38,319,967 | 38319967 | $81,192,832 | 81192832 | $-42,872,865 | -42872865 |
| 2007 | $25,790,800 | 25790800 | $85,747,487 | 85747487 | $-59,956,687 | -59956687 |
| 2008 | $47,124,500 | 47124500 | $93,079,041 | 93079041 | $-45,954,541 | -45954541 |
| 2009 | $65,401,368 | 65401368 | $92,957,049 | 92957049 | $-27,555,681 | -27555681 |
| 2010 | $74,487,608 | 74487608 | $94,957,956 | 94957956 | $-20,470,348 | -20470348 |
| 2011 | $41,901,308 | 41901308 | $97,426,414 | 97426414 | $-55,525,106 | -55525106 |
| 2012 | $63,626,675 | 63626675 | $100,689,500 | 100689500 | $-37,062,825 | -37062825 |
| 2013 | $61,928,975 | 61928975 | $106,658,387 | 106658387 | $-44,729,412 | -44729412 |
| 2014 | $76,872,383 | 76872383 | $115,428,670 | 115428670 | $-38,556,287 | -38556287 |
| 2015 | $77,294,234 | 77294234 | $125,458,486 | 125458486 | $-48,164,252 | -48164252 |
| 2016 | $66,681,991 | 66681991 | $130,290,910 | 130290910 | $-63,608,919 | -63608919 |
| 2017 | $70,612,800 | 70612800 | $136,573,000 | 136573000 | $-65,960,200 | -65960200 |
| 2018 | $76,007,496 | 76007496 | $135,681,867 | 135681867 | $-59,674,371 | -59674371 |
| 2019 | $60,084,133 | 60084133 | $134,776,225 | 134776225 | $-74,692,092 | -74692092 |
| 2020 | $69,303,833 | 69303833 | $138,321,485 | 138321485 | $-69,017,652 | -69017652 |
| 2021 | $63,714,834 | 63714834 | $129,635,938 | 129635938 | $-65,921,104 | -65921104 |
| 2022 | $85,728,178 | 85728178 | $147,002,411 | 147002411 | $-61,274,233 | -61274233 |
| 2023 | $73,184,811 | 73184811 | $158,155,877 | 158155877 | $-84,971,066 | -84971066 |
| 2024 | $56,128,512 | 56128512 | $133,074,721 | 133074721 | $-76,946,209 | -76946209 |
| 2025 | $51,971,212 | 51971212 | $94,180,059 | 94180059 | $-42,208,847 | -42208847 |
| 2026 | $26,954,545 | 26954545 | $74,818,461 | 74818461 | $-47,863,916 | -47863916 |
| 2027 | $23,204,545 | 23204545 | $56,972,319 | 56972319 | $-33,767,774 | -33767774 |
| 2028 | $25,454,546 | 25454546 | $45,437,759 | 45437759 | $-19,983,213 | -19983213 |
| 2029 | $25,454,546 | 25454546 | $37,269,628 | 37269628 | $-11,815,082 | -11815082 |
| 2030 | $25,454,546 | 25454546 | $39,665,769 | 39665769 | $-14,211,223 | -14211223 |
| 2031 | $25,454,546 | 25454546 | $38,360,152 | 38360152 | $-12,905,606 | -12905606 |
| 2032 | $25,454,546 | 25454546 | $47,925,459 | 47925459 | $-22,470,913 | -22470913 |
| 2033 | $2,000,000 | 2000000 | $43,068,924 | 43068924 | $-41,068,924 | -41068924 |
|
 2016 Tampa Bay Rays