| Player | Player Sort | Pos | Salary | Salary Sort | Pct | Pct Sort | WARP | WARP Sort | WARP/$M | WARP/$M Sort | $/WARP | $/WARP Sort | Current Status |
|---|
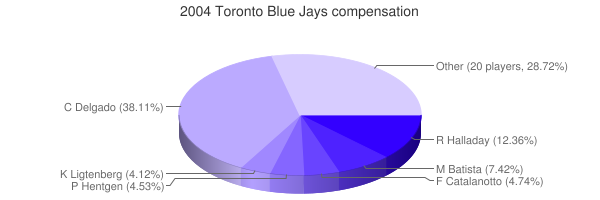
 Carlos Delgado
 |
Delgado Carlos |
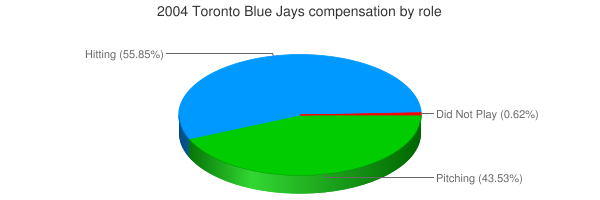
1B |
$18,500,000 |
18500000 |
37.74% |
37.74 |
2.39 |
2.38652 |
0.13 |
0.12900108108108 |
$7,751,873 |
7751873.0201297 |
|
 Roy Halladay
 |
Halladay Roy |
RP |
$6,000,000 |
6000000 |
12.24% |
12.24 |
3.18 |
3.17552 |
0.53 |
0.52925333333333 |
$1,889,454 |
1889454.3255908 |
|
 Miguel Batista
 |
Batista Miguel |
RP |
$3,600,000 |
3600000 |
7.34% |
7.34 |
-2.23 |
-2.22567 |
— |
0 |
— |
0 |
|
 Frank Catalanotto
 |
Catalanotto Frank |
LF |
$2,300,000 |
2300000 |
4.69% |
4.69 |
0.12 |
0.115153 |
0.05 |
0.05006652173913 |
$19,973,427 |
19973426.658446 |
|
 Pat Hentgen
 |
Hentgen Pat |
RP |
$2,200,000 |
2200000 |
4.49% |
4.49 |
-2.31 |
-2.30655 |
— |
0 |
— |
0 |
|
 Kerry Ligtenberg
 |
Ligtenberg Kerry |
RP |
$2,000,000 |
2000000 |
4.08% |
4.08 |
0.81 |
0.809784 |
0.40 |
0.404892 |
$2,469,794 |
2469794.414313 |
|
 Ted Lilly
 |
Lilly Ted |
RP |
$1,900,000 |
1900000 |
3.88% |
3.88 |
0.21 |
0.212861 |
0.11 |
0.11203210526316 |
$8,926,013 |
8926012.7501045 |
|
 Terry Adams
 |
Adams Terry |
RP |
$1,700,000 |
1700000 |
3.47% |
3.47 |
0.86 |
0.858142 |
0.50 |
0.50478941176471 |
$1,981,024 |
1981024.1195513 |
|
 Justin Speier
 |
Speier Justin |
RP |
$1,600,000 |
1600000 |
3.26% |
3.26 |
0.26 |
0.263543 |
0.16 |
0.164714375 |
$6,071,116 |
6071115.5295341 |
|
 Greg Myers
 |
Myers Greg |
C |
$900,000 |
900000 |
1.84% |
1.84 |
-0.01 |
-0.00779407 |
— |
0 |
— |
0 |
|
 Vernon Wells
 |
Wells Vernon |
CF |
$870,000 |
870000 |
1.77% |
1.77 |
2.55 |
2.55189 |
2.93 |
2.9332068965517 |
$340,924 |
340923.78589986 |
|
 Valerio De Los Santos
 |
De Los Santos Valerio |
RP |
$850,000 |
850000 |
1.73% |
1.73 |
0.06 |
0.0583629 |
0.07 |
0.068662235294118 |
$14,564,047 |
14564046.68034 |
|
 Eric Hinske
 |
Hinske Eric |
3B |
$800,000 |
800000 |
1.63% |
1.63 |
-1.03 |
-1.0299 |
— |
0 |
— |
0 |
|
 Dave Berg
 |
Berg Dave |
LF |
$800,000 |
800000 |
1.63% |
1.63 |
-1.20 |
-1.20487 |
— |
0 |
— |
0 |
|
 Chris Woodward
 |
Woodward Chris |
SS |
$775,000 |
775000 |
1.58% |
1.58 |
0.61 |
0.607173 |
0.78 |
0.78344903225806 |
$1,276,407 |
1276407.218371 |
|
 Chris Gomez
 |
Gomez Chris |
SS |
$750,000 |
750000 |
1.53% |
1.53 |
1.13 |
1.13166 |
1.51 |
1.50888 |
$662,743 |
662743.22676422 |
|
 Josh Phelps
 |
Phelps Josh |
DH |
$342,000 |
342000 |
0.70% |
0.70 |
-0.66 |
-0.657953 |
— |
0 |
— |
0 |
|
 Josh Towers
 |
Towers Josh |
RP |
$340,000 |
340000 |
0.69% |
0.69 |
-0.33 |
-0.328863 |
— |
0 |
— |
0 |
|
 Orlando Hudson
 |
Hudson Orlando |
2B |
$322,000 |
322000 |
0.66% |
0.66 |
3.60 |
3.60367 |
11.19 |
11.19152173913 |
$89,353 |
89353.353664459 |
|
 Aquilino Lopez
 |
Lopez Aquilino |
RP |
$318,000 |
318000 |
0.65% |
0.65 |
-0.25 |
-0.247423 |
— |
0 |
— |
0 |
|
 Reed Johnson
 |
Johnson Reed |
LF |
$318,000 |
318000 |
0.65% |
0.65 |
-0.04 |
-0.0356011 |
— |
0 |
— |
0 |
|
 Jason Kershner
 |
Kershner Jason |
RP |
$315,000 |
315000 |
0.64% |
0.64 |
0.19 |
0.189748 |
0.60 |
0.6023746031746 |
$1,660,097 |
1660096.5491072 |
|
 Bob File
 |
File Bob |
RP |
$310,000 |
310000 |
0.63% |
0.63 |
-0.03 |
-0.0334854 |
— |
0 |
— |
0 |
|
 Sean Douglass
 |
Douglass Sean |
RP |
$305,000 |
305000 |
0.62% |
0.62 |
-0.14 |
-0.141749 |
— |
0 |
— |
0 |
|
 Kevin Cash
 |
Cash Kevin |
C |
$302,000 |
302000 |
0.62% |
0.62 |
-1.19 |
-1.19161 |
— |
0 |
— |
0 |
|
 Brian Tallet
 |
Tallet Brian |
DNP |
$301,000 |
301000 |
0.61% |
0.61 |
— |
0.00 |
— |
0 |
— |
0 |
|
 Simon Pond
 |
Pond Simon |
LF |
$300,000 |
300000 |
0.61% |
0.61 |
-0.48 |
-0.481711 |
— |
0 |
— |
0 |
|
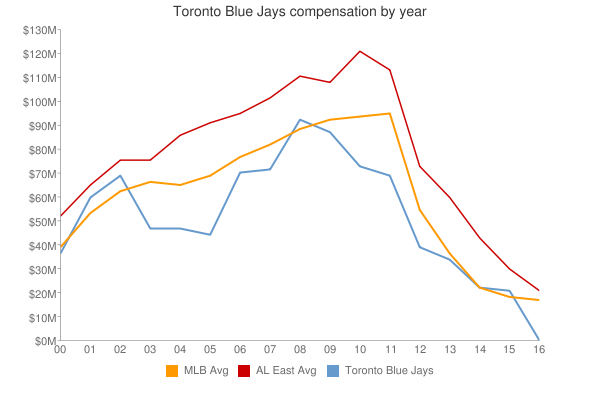
| Year | Blue Jays payroll |
PR Sort |
Avg payroll |
AvgPR Sort |
Diff |
Diff Sort |
|---|
| 2000 | $45,518,332 | 45518332 | $55,368,142 | 55368142 | $-9,849,810 | -9849810 |
| 2001 | $76,322,999 | 76322999 | $64,937,084 | 64937084 | $11,385,915 | 11385915 |
| 2002 | $76,464,333 | 76464333 | $67,238,672 | 67238672 | $9,225,661 | 9225661 |
| 2003 | $49,679,000 | 49679000 | $70,654,480 | 70654480 | $-20,975,480 | -20975480 |
| 2004 | $49,018,000 | 49018000 | $69,466,729 | 69466729 | $-20,448,729 | -20448729 |
| 2005 | $45,801,500 | 45801500 | $74,114,841 | 74114841 | $-28,313,341 | -28313341 |
| 2006 | $69,295,000 | 69295000 | $79,621,815 | 79621815 | $-10,326,815 | -10326815 |
| 2007 | $84,315,000 | 84315000 | $85,537,470 | 85537470 | $-1,222,470 | -1222470 |
| 2008 | $104,368,800 | 104368800 | $92,003,799 | 92003799 | $12,365,001 | 12365001 |
| 2009 | $81,842,100 | 81842100 | $92,169,598 | 92169598 | $-10,327,498 | -10327498 |
| 2010 | $76,189,000 | 76189000 | $94,342,601 | 94342601 | $-18,153,601 | -18153601 |
| 2011 | $70,317,800 | 70317800 | $96,974,710 | 96974710 | $-26,656,910 | -26656910 |
| 2012 | $83,739,200 | 83739200 | $100,947,217 | 100947217 | $-17,208,017 | -17208017 |
| 2013 | $127,777,800 | 127777800 | $108,586,966 | 108586966 | $19,190,834 | 19190834 |
| 2014 | $137,177,700 | 137177700 | $117,131,361 | 117131361 | $20,046,339 | 20046339 |
| 2015 | $125,915,800 | 125915800 | $126,168,161 | 126168161 | $-252,361 | -252361 |
| 2016 | $136,782,027 | 136782027 | $131,756,569 | 131756569 | $5,025,458 | 5025458 |
| 2017 | $163,381,937 | 163381937 | $136,337,445 | 136337445 | $27,044,492 | 27044492 |
| 2018 | $162,037,223 | 162037223 | $135,360,600 | 135360600 | $26,676,623 | 26676623 |
| 2019 | $117,546,171 | 117546171 | $134,792,134 | 134792134 | $-17,245,963 | -17245963 |
| 2020 | $108,987,471 | 108987471 | $139,496,467 | 139496467 | $-30,508,996 | -30508996 |
| 2021 | $140,375,671 | 140375671 | $130,712,288 | 130712288 | $9,663,383 | 9663383 |
| 2022 | $166,851,121 | 166851121 | $149,802,695 | 149802695 | $17,048,426 | 17048426 |
| 2023 | $186,938,983 | 186938983 | $161,692,345 | 161692345 | $25,246,638 | 25246638 |
| 2024 | $181,399,600 | 181399600 | $136,306,249 | 136306249 | $45,093,351 | 45093351 |
| 2025 | $130,750,000 | 130750000 | $98,329,527 | 98329527 | $32,420,473 | 32420473 |
| 2026 | $95,166,667 | 95166667 | $78,039,273 | 78039273 | $17,127,394 | 17127394 |
| 2027 | $30,000,000 | 30000000 | $60,919,343 | 60919343 | $-30,919,343 | -30919343 |
| 2028 | $30,000,000 | 30000000 | $46,901,712 | 46901712 | $-16,901,712 | -16901712 |
|
 2004 Toronto Blue Jays