| Player | Player Sort | Pos | Salary | Salary Sort | Pct | Pct Sort | WARP | WARP Sort | WARP/$M | WARP/$M Sort | $/WARP | $/WARP Sort | Current Status |
|---|
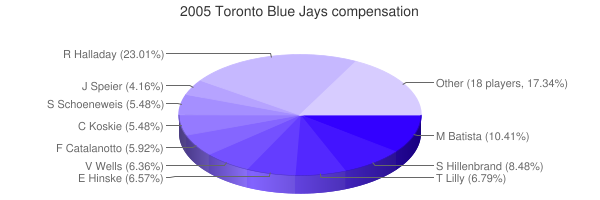
 Roy Halladay
 |
Halladay Roy |
RP |
$10,500,000 |
10500000 |
22.93% |
22.93 |
4.30 |
4.2975 |
0.41 |
0.40928571428571 |
$2,443,281 |
2443280.9773124 |
|
 Miguel Batista
 |
Batista Miguel |
RP |
$4,750,000 |
4750000 |
10.37% |
10.37 |
0.69 |
0.691166 |
0.15 |
0.14550863157895 |
$6,872,445 |
6872444.5357555 |
|
 Shea Hillenbrand
 |
Hillenbrand Shea |
1B |
$3,870,000 |
3870000 |
8.45% |
8.45 |
1.72 |
1.72425 |
0.45 |
0.44554263565891 |
$2,244,454 |
2244454.1104828 |
|
 Ted Lilly
 |
Lilly Ted |
RP |
$3,100,000 |
3100000 |
6.77% |
6.77 |
-1.70 |
-1.70314 |
— |
0 |
— |
0 |
|
 Vernon Wells
 |
Wells Vernon |
CF |
$3,070,000 |
3070000 |
6.70% |
6.70 |
1.85 |
1.85091 |
0.60 |
0.60290228013029 |
$1,658,644 |
1658643.5861279 |
|
 Eric Hinske
 |
Hinske Eric |
1B |
$3,000,000 |
3000000 |
6.55% |
6.55 |
1.30 |
1.2962 |
0.43 |
0.43206666666667 |
$2,314,458 |
2314457.6454251 |
|
 Frank Catalanotto
 |
Catalanotto Frank |
LF |
$2,700,000 |
2700000 |
5.90% |
5.90 |
2.00 |
1.99944 |
0.74 |
0.74053333333333 |
$1,350,378 |
1350378.1058696 |
|
 Corey Koskie
 |
Koskie Corey |
3B |
$2,500,000 |
2500000 |
5.46% |
5.46 |
0.89 |
0.892908 |
0.36 |
0.3571632 |
$2,799,841 |
2799840.5210839 |
|
 Scott Schoeneweis
 |
Schoeneweis Scott |
RP |
$2,500,000 |
2500000 |
5.46% |
5.46 |
0.85 |
0.851747 |
0.34 |
0.3406988 |
$2,935,144 |
2935143.8866236 |
|
 Justin Speier
 |
Speier Justin |
RP |
$1,900,000 |
1900000 |
4.15% |
4.15 |
1.10 |
1.09873 |
0.58 |
0.57827894736842 |
$1,729,269 |
1729269.2472218 |
|
 Gregg Zaun
 |
Zaun Gregg |
C |
$950,000 |
950000 |
2.07% |
2.07 |
3.14 |
3.13973 |
3.30 |
3.3049789473684 |
$302,574 |
302573.78819198 |
|
 Billy Koch
 |
Koch Billy |
DNP |
$900,000 |
900000 |
1.97% |
1.97 |
— |
0.00 |
— |
0 |
— |
0 |
|
 Greg Myers
 |
Myers Greg |
C |
$700,000 |
700000 |
1.53% |
1.53 |
-0.24 |
-0.243367 |
— |
0 |
— |
0 |
|
 Frank Menechino
 |
Menechino Frank |
2B |
$600,000 |
600000 |
1.31% |
1.31 |
0.64 |
0.638844 |
1.06 |
1.06474 |
$939,196 |
939196.42354002 |
|
 John McDonald
 |
McDonald John |
SS |
$400,000 |
400000 |
0.87% |
0.87 |
0.20 |
0.19529 |
0.49 |
0.488225 |
$2,048,236 |
2048235.9567822 |
|
 Pete Walker
 |
Walker Pete |
RP |
$400,000 |
400000 |
0.87% |
0.87 |
-0.91 |
-0.905355 |
— |
0 |
— |
0 |
|
 Orlando Hudson
 |
Hudson Orlando |
2B |
$365,000 |
365000 |
0.80% |
0.80 |
1.92 |
1.92415 |
5.27 |
5.2716438356164 |
$189,694 |
189694.15066393 |
|
 Josh Towers
 |
Towers Josh |
RP |
$358,000 |
358000 |
0.78% |
0.78 |
1.83 |
1.82657 |
5.10 |
5.1021508379888 |
$195,996 |
195995.77349896 |
|
 Reed Johnson
 |
Johnson Reed |
LF |
$342,000 |
342000 |
0.75% |
0.75 |
0.73 |
0.731579 |
2.14 |
2.1391198830409 |
$467,482 |
467481.98075669 |
|
 Jason Frasor
 |
Frasor Jason |
RP |
$332,500 |
332500 |
0.73% |
0.73 |
1.53 |
1.5282 |
4.60 |
4.5960902255639 |
$217,576 |
217576.23347729 |
|
 Alex Rios
 |
Rios Alex |
RF |
$331,000 |
331000 |
0.72% |
0.72 |
0.88 |
0.884145 |
2.67 |
2.6711329305136 |
$374,373 |
374372.98180728 |
|
 Dave Bush
 |
Bush Dave |
RP |
$327,000 |
327000 |
0.71% |
0.71 |
0.28 |
0.275196 |
0.84 |
0.84157798165138 |
$1,188,244 |
1188244.0151746 |
|
 Vinnie Chulk
 |
Chulk Vinnie |
RP |
$326,000 |
326000 |
0.71% |
0.71 |
-0.55 |
-0.550864 |
— |
0 |
— |
0 |
|
 Gabe Gross
 |
Gross Gabe |
RF |
$316,000 |
316000 |
0.69% |
0.69 |
-0.12 |
-0.115054 |
— |
0 |
— |
0 |
|
 Gustavo Chacin
 |
Chacin Gustavo |
RP |
$316,000 |
316000 |
0.69% |
0.69 |
-2.89 |
-2.89057 |
— |
0 |
— |
0 |
|
 Brandon League
 |
League Brandon |
RP |
$316,000 |
316000 |
0.69% |
0.69 |
-0.98 |
-0.976513 |
— |
0 |
— |
0 |
|
 Ben Howard
 |
Howard Ben |
DNP |
$316,000 |
316000 |
0.69% |
0.69 |
— |
0.00 |
— |
0 |
— |
0 |
|
 Russ Adams
 |
Adams Russ |
SS |
$316,000 |
316000 |
0.69% |
0.69 |
0.26 |
0.263193 |
0.83 |
0.83288924050633 |
$1,200,640 |
1200639.8346461 |
|
| Year | Blue Jays payroll |
PR Sort |
Avg payroll |
AvgPR Sort |
Diff |
Diff Sort |
|---|
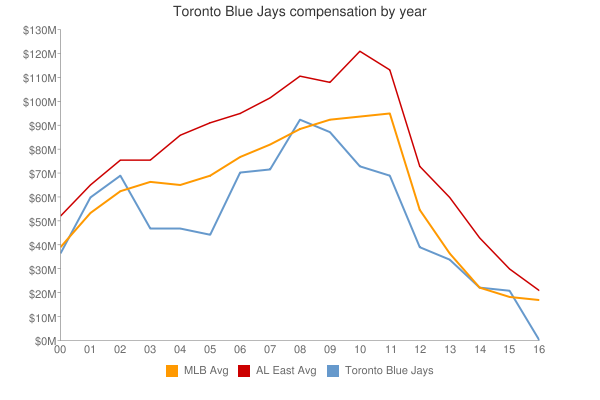
| 2000 | $45,518,332 | 45518332 | $56,164,089 | 56164089 | $-10,645,757 | -10645757 |
| 2001 | $76,322,999 | 76322999 | $65,991,638 | 65991638 | $10,331,361 | 10331361 |
| 2002 | $76,464,333 | 76464333 | $68,244,471 | 68244471 | $8,219,862 | 8219862 |
| 2003 | $49,679,000 | 49679000 | $71,318,479 | 71318479 | $-21,639,479 | -21639479 |
| 2004 | $49,018,000 | 49018000 | $70,466,961 | 70466961 | $-21,448,961 | -21448961 |
| 2005 | $45,801,500 | 45801500 | $73,264,780 | 73264780 | $-27,463,280 | -27463280 |
| 2006 | $69,295,000 | 69295000 | $79,051,754 | 79051754 | $-9,756,754 | -9756754 |
| 2007 | $84,315,000 | 84315000 | $83,931,138 | 83931138 | $383,862 | 383862 |
| 2008 | $104,368,800 | 104368800 | $90,812,373 | 90812373 | $13,556,427 | 13556427 |
| 2009 | $81,842,100 | 81842100 | $91,093,211 | 91093211 | $-9,251,111 | -9251111 |
| 2010 | $76,189,000 | 76189000 | $93,373,681 | 93373681 | $-17,184,681 | -17184681 |
| 2011 | $70,317,800 | 70317800 | $96,102,034 | 96102034 | $-25,784,234 | -25784234 |
| 2012 | $83,739,200 | 83739200 | $100,657,138 | 100657138 | $-16,917,938 | -16917938 |
| 2013 | $127,777,800 | 127777800 | $109,024,990 | 109024990 | $18,752,810 | 18752810 |
| 2014 | $137,177,700 | 137177700 | $117,828,782 | 117828782 | $19,348,918 | 19348918 |
| 2015 | $125,915,800 | 125915800 | $127,404,244 | 127404244 | $-1,488,444 | -1488444 |
| 2016 | $136,782,027 | 136782027 | $132,219,407 | 132219407 | $4,562,620 | 4562620 |
| 2017 | $163,381,937 | 163381937 | $137,302,894 | 137302894 | $26,079,043 | 26079043 |
| 2018 | $162,037,223 | 162037223 | $136,929,168 | 136929168 | $25,108,055 | 25108055 |
| 2019 | $117,546,171 | 117546171 | $136,944,257 | 136944257 | $-19,398,086 | -19398086 |
| 2020 | $108,987,471 | 108987471 | $140,677,788 | 140677788 | $-31,690,317 | -31690317 |
| 2021 | $140,375,671 | 140375671 | $132,162,631 | 132162631 | $8,213,040 | 8213040 |
| 2022 | $166,851,121 | 166851121 | $149,374,046 | 149374046 | $17,477,075 | 17477075 |
| 2023 | $186,938,983 | 186938983 | $160,460,390 | 160460390 | $26,478,593 | 26478593 |
| 2024 | $181,399,600 | 181399600 | $135,504,022 | 135504022 | $45,895,578 | 45895578 |
| 2025 | $130,750,000 | 130750000 | $96,417,302 | 96417302 | $34,332,698 | 34332698 |
| 2026 | $95,166,667 | 95166667 | $76,694,120 | 76694120 | $18,472,547 | 18472547 |
| 2027 | $30,000,000 | 30000000 | $58,935,617 | 58935617 | $-28,935,617 | -28935617 |
| 2028 | $30,000,000 | 30000000 | $45,437,759 | 45437759 | $-15,437,759 | -15437759 |
|
 2005 Toronto Blue Jays