| Player | Player Sort | Pos | Salary | Salary Sort | Pct | Pct Sort | WARP | WARP Sort | WARP/$M | WARP/$M Sort | $/WARP | $/WARP Sort | Current Status |
|---|
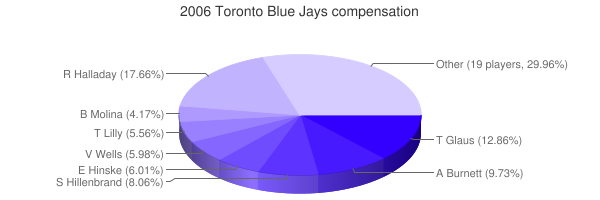
 Roy Halladay
 |
Halladay Roy |
RP |
$12,700,000 |
12700000 |
18.33% |
18.33 |
5.29 |
5.29335 |
0.42 |
0.41679921259843 |
$2,399,237 |
2399236.7782217 |
|
 Troy Glaus
 |
Glaus Troy |
3B |
$9,250,000 |
9250000 |
13.35% |
13.35 |
2.65 |
2.64609 |
0.29 |
0.28606378378378 |
$3,495,724 |
3495723.8793843 |
|
 Shea Hillenbrand
 |
Hillenbrand Shea |
DH |
$5,800,000 |
5800000 |
8.37% |
8.37 |
0.39 |
0.385211 |
0.07 |
0.066415689655172 |
$15,056,683 |
15056683.220365 |
|
 Vernon Wells
 |
Wells Vernon |
CF |
$4,470,000 |
4470000 |
6.45% |
6.45 |
4.13 |
4.13035 |
0.92 |
0.92401565995526 |
$1,082,233 |
1082232.7405668 |
|
 Eric Hinske
 |
Hinske Eric |
RF |
$4,325,000 |
4325000 |
6.24% |
6.24 |
0.45 |
0.447196 |
0.10 |
0.10339791907514 |
$9,671,375 |
9671374.5203445 |
|
 Ted Lilly
 |
Lilly Ted |
RP |
$4,000,000 |
4000000 |
5.77% |
5.77 |
1.84 |
1.84187 |
0.46 |
0.4604675 |
$2,171,706 |
2171705.9293001 |
|
 B.J. Ryan
 |
Ryan B.J. |
RP |
$4,000,000 |
4000000 |
5.77% |
5.77 |
2.37 |
2.36636 |
0.59 |
0.59159 |
$1,690,360 |
1690359.8776179 |
|
 Bengie Molina
 |
Molina Bengie |
C |
$3,000,000 |
3000000 |
4.33% |
4.33 |
1.47 |
1.4704 |
0.49 |
0.49013333333333 |
$2,040,261 |
2040261.1534276 |
|
 Scott Schoeneweis
 |
Schoeneweis Scott |
RP |
$2,750,000 |
2750000 |
3.97% |
3.97 |
-0.27 |
-0.272528 |
— |
0 |
— |
0 |
|
 Frank Catalanotto
 |
Catalanotto Frank |
LF |
$2,700,000 |
2700000 |
3.90% |
3.90 |
1.24 |
1.23907 |
0.46 |
0.45891481481481 |
$2,179,054 |
2179053.6450725 |
|
 Lyle Overbay
 |
Overbay Lyle |
1B |
$2,525,000 |
2525000 |
3.64% |
3.64 |
2.25 |
2.25131 |
0.89 |
0.89160792079208 |
$1,121,569 |
1121569.2196988 |
|
 Josh Towers
 |
Towers Josh |
RP |
$2,300,000 |
2300000 |
3.32% |
3.32 |
-1.03 |
-1.02571 |
— |
0 |
— |
0 |
|
 Justin Speier
 |
Speier Justin |
RP |
$2,250,000 |
2250000 |
3.25% |
3.25 |
0.75 |
0.751499 |
0.33 |
0.33399955555556 |
$2,994,016 |
2994015.9601011 |
|
 A.J. Burnett
 |
Burnett A.J. |
RP |
$2,200,000 |
2200000 |
3.17% |
3.17 |
3.11 |
3.11044 |
1.41 |
1.4138363636364 |
$707,295 |
707295.43087152 |
|
 Reed Johnson
 |
Johnson Reed |
LF |
$1,425,000 |
1425000 |
2.06% |
2.06 |
3.50 |
3.50485 |
2.46 |
2.4595438596491 |
$406,579 |
406579.45418492 |
|
 Gregg Zaun
 |
Zaun Gregg |
C |
$1,000,000 |
1000000 |
1.44% |
1.44 |
1.01 |
1.00925 |
1.01 |
1.00925 |
$990,835 |
990834.77830072 |
|
 Scott Downs
 |
Downs Scott |
RP |
$705,000 |
705000 |
1.02% |
1.02 |
1.29 |
1.28859 |
1.83 |
1.8277872340426 |
$547,110 |
547109.63145764 |
|
 Pete Walker
 |
Walker Pete |
RP |
$650,000 |
650000 |
0.94% |
0.94 |
0.59 |
0.590145 |
0.91 |
0.90791538461538 |
$1,101,424 |
1101424.2262495 |
|
 John McDonald
 |
McDonald John |
SS |
$500,000 |
500000 |
0.72% |
0.72 |
-0.68 |
-0.684059 |
— |
0 |
— |
0 |
|
 Jason Frasor
 |
Frasor Jason |
RP |
$359,000 |
359000 |
0.52% |
0.52 |
1.32 |
1.32246 |
3.68 |
3.6837325905292 |
$271,464 |
271463.78718449 |
|
 Alex Rios
 |
Rios Alex |
RF |
$354,000 |
354000 |
0.51% |
0.51 |
2.87 |
2.86988 |
8.11 |
8.1070056497175 |
$123,350 |
123350.10523088 |
|
 Vinnie Chulk
 |
Chulk Vinnie |
RP |
$348,500 |
348500 |
0.50% |
0.50 |
0.27 |
0.273758 |
0.79 |
0.78553228120517 |
$1,273,022 |
1273022.1582566 |
|
 Gustavo Chacin
 |
Chacin Gustavo |
RP |
$347,500 |
347500 |
0.50% |
0.50 |
-2.02 |
-2.01782 |
— |
0 |
— |
0 |
|
 Russ Adams
 |
Adams Russ |
2B |
$343,000 |
343000 |
0.49% |
0.49 |
-1.03 |
-1.02859 |
— |
0 |
— |
0 |
|
 Aaron Hill
 |
Hill Aaron |
2B |
$336,000 |
336000 |
0.48% |
0.48 |
2.13 |
2.13024 |
6.34 |
6.34 |
$157,729 |
157728.70662461 |
|
 Jeremy Accardo
 |
Accardo Jeremy |
RP |
$330,000 |
330000 |
0.48% |
0.48 |
0.44 |
0.444418 |
1.35 |
1.3467212121212 |
$742,544 |
742544.18137879 |
|
 Brian Tallet
 |
Tallet Brian |
RP |
$327,000 |
327000 |
0.47% |
0.47 |
-0.89 |
-0.891485 |
— |
0 |
— |
0 |
|
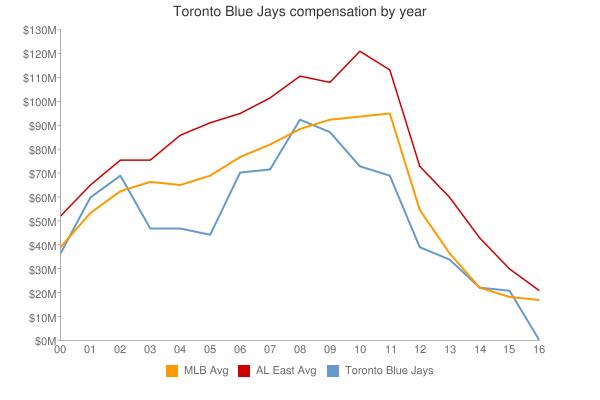
| Year | Blue Jays payroll |
PR Sort |
Avg payroll |
AvgPR Sort |
Diff |
Diff Sort |
|---|
| 2000 | $45,518,332 | 45518332 | $56,164,089 | 56164089 | $-10,645,757 | -10645757 |
| 2001 | $76,322,999 | 76322999 | $65,991,638 | 65991638 | $10,331,361 | 10331361 |
| 2002 | $76,464,333 | 76464333 | $68,244,471 | 68244471 | $8,219,862 | 8219862 |
| 2003 | $49,679,000 | 49679000 | $71,318,479 | 71318479 | $-21,639,479 | -21639479 |
| 2004 | $49,018,000 | 49018000 | $70,466,961 | 70466961 | $-21,448,961 | -21448961 |
| 2005 | $45,801,500 | 45801500 | $73,264,780 | 73264780 | $-27,463,280 | -27463280 |
| 2006 | $69,295,000 | 69295000 | $79,051,754 | 79051754 | $-9,756,754 | -9756754 |
| 2007 | $84,315,000 | 84315000 | $83,931,138 | 83931138 | $383,862 | 383862 |
| 2008 | $104,368,800 | 104368800 | $90,812,373 | 90812373 | $13,556,427 | 13556427 |
| 2009 | $81,842,100 | 81842100 | $91,093,211 | 91093211 | $-9,251,111 | -9251111 |
| 2010 | $76,189,000 | 76189000 | $93,373,681 | 93373681 | $-17,184,681 | -17184681 |
| 2011 | $70,317,800 | 70317800 | $96,102,034 | 96102034 | $-25,784,234 | -25784234 |
| 2012 | $83,739,200 | 83739200 | $100,657,138 | 100657138 | $-16,917,938 | -16917938 |
| 2013 | $127,777,800 | 127777800 | $109,024,990 | 109024990 | $18,752,810 | 18752810 |
| 2014 | $137,177,700 | 137177700 | $117,828,782 | 117828782 | $19,348,918 | 19348918 |
| 2015 | $125,915,800 | 125915800 | $127,404,244 | 127404244 | $-1,488,444 | -1488444 |
| 2016 | $136,782,027 | 136782027 | $132,219,407 | 132219407 | $4,562,620 | 4562620 |
| 2017 | $163,381,937 | 163381937 | $137,302,894 | 137302894 | $26,079,043 | 26079043 |
| 2018 | $162,037,223 | 162037223 | $136,929,168 | 136929168 | $25,108,055 | 25108055 |
| 2019 | $117,546,171 | 117546171 | $136,944,257 | 136944257 | $-19,398,086 | -19398086 |
| 2020 | $108,987,471 | 108987471 | $140,677,788 | 140677788 | $-31,690,317 | -31690317 |
| 2021 | $140,375,671 | 140375671 | $132,162,631 | 132162631 | $8,213,040 | 8213040 |
| 2022 | $166,851,121 | 166851121 | $149,374,046 | 149374046 | $17,477,075 | 17477075 |
| 2023 | $186,938,983 | 186938983 | $160,460,390 | 160460390 | $26,478,593 | 26478593 |
| 2024 | $181,399,600 | 181399600 | $135,504,022 | 135504022 | $45,895,578 | 45895578 |
| 2025 | $130,750,000 | 130750000 | $96,417,302 | 96417302 | $34,332,698 | 34332698 |
| 2026 | $95,166,667 | 95166667 | $76,694,120 | 76694120 | $18,472,547 | 18472547 |
| 2027 | $30,000,000 | 30000000 | $58,935,617 | 58935617 | $-28,935,617 | -28935617 |
| 2028 | $30,000,000 | 30000000 | $45,437,759 | 45437759 | $-15,437,759 | -15437759 |
|
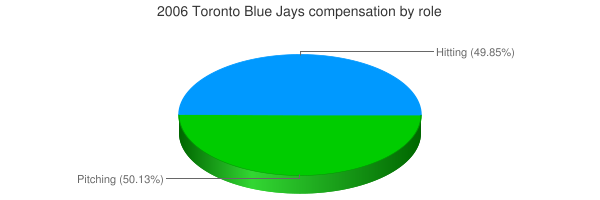
 2006 Toronto Blue Jays