| Player | Player Sort | Pos | Salary | Salary Sort | Pct | Pct Sort | WARP | WARP Sort | WARP/$M | WARP/$M Sort | $/WARP | $/WARP Sort | Current Status |
|---|
 José Bautista
 |
Bautista Jose |
RF |
$14,000,000 |
14000000 |
10.96% |
10.96 |
3.49 |
3.48724 |
0.25 |
0.24908857142857 |
$4,014,636 |
4014636.2166068 |
|
 Josh Johnson
 |
Johnson Josh |
RP |
$13,750,000 |
13750000 |
10.76% |
10.76 |
0.28 |
0.282163 |
0.02 |
0.020520945454545 |
$48,730,698 |
48730698.213444 |
|
 Mark Buehrle
 |
Buehrle Mark |
RP |
$12,000,000 |
12000000 |
9.39% |
9.39 |
1.64 |
1.64008 |
0.14 |
0.13667333333333 |
$7,316,716 |
7316716.2577435 |
|
 José Reyes
 |
Reyes Jose |
SS |
$10,000,000 |
10000000 |
7.83% |
7.83 |
3.41 |
3.40548 |
0.34 |
0.340548 |
$2,936,444 |
2936443.6144097 |
|
 Melky Cabrera
 |
Cabrera Melky |
LF |
$8,000,000 |
8000000 |
6.26% |
6.26 |
-0.06 |
-0.0638904 |
— |
0 |
— |
0 |
|
 Brandon Morrow
 |
Morrow Brandon |
RP |
$8,000,000 |
8000000 |
6.26% |
6.26 |
-1.21 |
-1.21478 |
— |
0 |
— |
0 |
|
 Edwin Encarnación
 |
Encarnacion Edwin |
1B |
$8,000,000 |
8000000 |
6.26% |
6.26 |
4.56 |
4.55633 |
0.57 |
0.56954125 |
$1,755,799 |
1755799.0751328 |
|
 Ricky Romero
 |
Romero Ricky |
RP |
$7,750,000 |
7750000 |
6.07% |
6.07 |
-0.29 |
-0.287528 |
— |
0 |
— |
0 |
|
 R.A. Dickey
 |
Dickey R.A. |
RP |
$5,250,000 |
5250000 |
4.11% |
4.11 |
3.51 |
3.50985 |
0.67 |
0.66854285714286 |
$1,495,790 |
1495790.4183939 |
|
 Adam Lind
 |
Lind Adam |
1B |
$5,150,000 |
5150000 |
4.03% |
4.03 |
2.36 |
2.35925 |
0.46 |
0.4581067961165 |
$2,182,897 |
2182897.1071315 |
|
 Colby Rasmus
 |
Rasmus Colby |
CF |
$4,675,000 |
4675000 |
3.66% |
3.66 |
4.06 |
4.05923 |
0.87 |
0.86828449197861 |
$1,151,696 |
1151696.2576646 |
|
 Casey Janssen
 |
Janssen Casey |
RP |
$3,900,000 |
3900000 |
3.05% |
3.05 |
1.08 |
1.07696 |
0.28 |
0.27614358974359 |
$3,621,304 |
3621304.4124201 |
|
 J.A. Happ
 |
Happ J.A. |
RP |
$3,700,000 |
3700000 |
2.90% |
2.90 |
-0.51 |
-0.506797 |
— |
0 |
— |
0 |
|
 Darren Oliver
 |
Oliver Darren |
RP |
$3,000,000 |
3000000 |
2.35% |
2.35 |
0.23 |
0.234737 |
0.08 |
0.078245666666667 |
$12,780,260 |
12780260.461708 |
|
 Maicer Izturis
 |
Izturis Maicer |
2B |
$3,000,000 |
3000000 |
2.35% |
2.35 |
-0.54 |
-0.543847 |
— |
0 |
— |
0 |
|
 Sergio Santos
 |
Santos Sergio |
RP |
$2,750,000 |
2750000 |
2.15% |
2.15 |
0.76 |
0.764864 |
0.28 |
0.27813236363636 |
$3,595,410 |
3595410.4259058 |
|
 Emilio Bonifácio
 |
Bonifacio Emilio |
2B |
$2,600,000 |
2600000 |
2.03% |
2.03 |
-0.07 |
-0.0733519 |
— |
0 |
— |
0 |
|
 Rajai Davis
 |
Davis Rajai |
LF |
$2,500,000 |
2500000 |
1.96% |
1.96 |
1.62 |
1.61781 |
0.65 |
0.647124 |
$1,545,299 |
1545298.8917116 |
|
 Dustin McGowan
 |
McGowan Dustin |
RP |
$1,500,000 |
1500000 |
1.17% |
1.17 |
0.31 |
0.306195 |
0.20 |
0.20413 |
$4,898,839 |
4898838.9751629 |
|
 Josh Thole
 |
Thole Josh |
C |
$1,250,000 |
1250000 |
0.98% |
0.98 |
-0.26 |
-0.259531 |
— |
0 |
— |
0 |
|
 Henry Blanco
 |
Blanco Henry |
C |
$750,000 |
750000 |
0.59% |
0.59 |
-0.37 |
-0.369959 |
— |
0 |
— |
0 |
|
 Mark DeRosa
 |
DeRosa Mark |
2B |
$750,000 |
750000 |
0.59% |
0.59 |
0.85 |
0.852734 |
1.14 |
1.1369786666667 |
$879,524 |
879523.97816904 |
|
 Brett Cecil
 |
Cecil Brett |
RP |
$510,000 |
510000 |
0.40% |
0.40 |
0.95 |
0.94757 |
1.86 |
1.8579803921569 |
$538,219 |
538218.81233049 |
|
 Esmil Rogers
 |
Rogers Esmil |
RP |
$509,000 |
509000 |
0.40% |
0.40 |
-1.35 |
-1.35145 |
— |
0 |
— |
0 |
|
 J.P. Arencibia
 |
Arencibia J.P. |
C |
$505,600 |
505600 |
0.40% |
0.40 |
0.58 |
0.580613 |
1.15 |
1.1483643196203 |
$870,804 |
870803.78840984 |
|
 Luis Perez
 |
Perez Luis |
RP |
$500,000 |
500000 |
0.39% |
0.39 |
-0.03 |
-0.0259507 |
— |
0 |
— |
0 |
|
 Brett Lawrie
 |
Lawrie Brett |
3B |
$500,000 |
500000 |
0.39% |
0.39 |
1.81 |
1.80753 |
3.62 |
3.61506 |
$276,621 |
276620.58167776 |
|
 Kyle Drabek
 |
Drabek Kyle |
RP |
$499,500 |
499500 |
0.39% |
0.39 |
-0.02 |
-0.023294 |
— |
0 |
— |
0 |
|
 Steve Delabar
 |
Delabar Steve |
RP |
$498,900 |
498900 |
0.39% |
0.39 |
1.17 |
1.1695 |
2.34 |
2.3441571457206 |
$426,593 |
426592.56092347 |
|
 Michael Schwimer
 |
Schwimer Michael |
DNP |
$496,500 |
496500 |
0.39% |
0.39 |
— |
0.00 |
— |
0 |
— |
0 |
|
 Jeremy Jeffress
 |
Jeffress Jeremy |
RP |
$495,900 |
495900 |
0.39% |
0.39 |
0.07 |
0.0735517 |
0.15 |
0.14831962089131 |
$6,742,196 |
6742196.3054559 |
|
 Aaron Loup
 |
Loup Aaron |
RP |
$494,200 |
494200 |
0.39% |
0.39 |
0.25 |
0.246149 |
0.50 |
0.49807567786321 |
$2,007,727 |
2007727.0271258 |
|
 Drew Hutchison
 |
Hutchison Drew |
DNP |
$493,200 |
493200 |
0.39% |
0.39 |
— |
0.00 |
— |
0 |
— |
0 |
|
| Year | Blue Jays payroll |
PR Sort |
Avg payroll |
AvgPR Sort |
Diff |
Diff Sort |
|---|
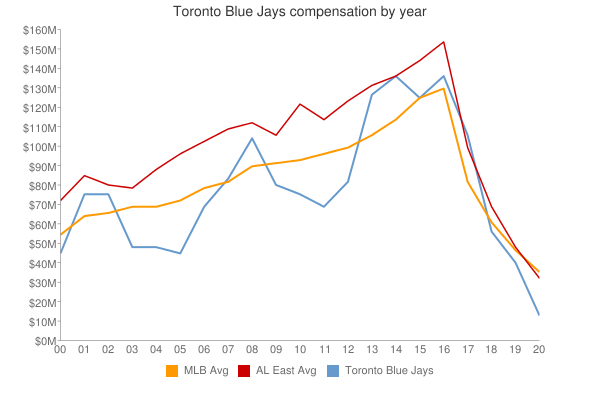
| 2000 | $45,518,332 | 45518332 | $57,491,092 | 57491092 | $-11,972,760 | -11972760 |
| 2001 | $76,322,999 | 76322999 | $67,120,750 | 67120750 | $9,202,249 | 9202249 |
| 2002 | $76,464,333 | 76464333 | $69,204,705 | 69204705 | $7,259,628 | 7259628 |
| 2003 | $49,679,000 | 49679000 | $72,156,639 | 72156639 | $-22,477,639 | -22477639 |
| 2004 | $49,018,000 | 49018000 | $71,426,357 | 71426357 | $-22,408,357 | -22408357 |
| 2005 | $45,801,500 | 45801500 | $73,628,169 | 73628169 | $-27,826,669 | -27826669 |
| 2006 | $69,295,000 | 69295000 | $81,192,832 | 81192832 | $-11,897,832 | -11897832 |
| 2007 | $84,315,000 | 84315000 | $85,747,487 | 85747487 | $-1,432,487 | -1432487 |
| 2008 | $104,368,800 | 104368800 | $93,079,041 | 93079041 | $11,289,759 | 11289759 |
| 2009 | $81,842,100 | 81842100 | $92,957,049 | 92957049 | $-11,114,949 | -11114949 |
| 2010 | $76,189,000 | 76189000 | $94,957,956 | 94957956 | $-18,768,956 | -18768956 |
| 2011 | $70,317,800 | 70317800 | $97,426,414 | 97426414 | $-27,108,614 | -27108614 |
| 2012 | $83,739,200 | 83739200 | $100,689,500 | 100689500 | $-16,950,300 | -16950300 |
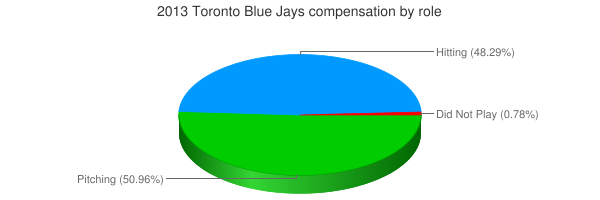
| 2013 | $127,777,800 | 127777800 | $106,658,387 | 106658387 | $21,119,413 | 21119413 |
| 2014 | $137,177,700 | 137177700 | $115,428,670 | 115428670 | $21,749,030 | 21749030 |
| 2015 | $125,915,800 | 125915800 | $125,458,486 | 125458486 | $457,314 | 457314 |
| 2016 | $136,782,027 | 136782027 | $130,290,910 | 130290910 | $6,491,117 | 6491117 |
| 2017 | $163,381,937 | 163381937 | $136,573,000 | 136573000 | $26,808,937 | 26808937 |
| 2018 | $162,037,223 | 162037223 | $135,681,867 | 135681867 | $26,355,356 | 26355356 |
| 2019 | $117,546,171 | 117546171 | $134,776,225 | 134776225 | $-17,230,054 | -17230054 |
| 2020 | $108,987,471 | 108987471 | $138,321,485 | 138321485 | $-29,334,014 | -29334014 |
| 2021 | $140,375,671 | 140375671 | $129,635,938 | 129635938 | $10,739,733 | 10739733 |
| 2022 | $166,851,121 | 166851121 | $147,002,411 | 147002411 | $19,848,710 | 19848710 |
| 2023 | $186,938,983 | 186938983 | $158,155,877 | 158155877 | $28,783,106 | 28783106 |
| 2024 | $181,399,600 | 181399600 | $133,074,721 | 133074721 | $48,324,879 | 48324879 |
| 2025 | $130,750,000 | 130750000 | $94,180,059 | 94180059 | $36,569,941 | 36569941 |
| 2026 | $95,166,667 | 95166667 | $74,818,461 | 74818461 | $20,348,206 | 20348206 |
| 2027 | $30,000,000 | 30000000 | $56,972,319 | 56972319 | $-26,972,319 | -26972319 |
| 2028 | $30,000,000 | 30000000 | $45,437,759 | 45437759 | $-15,437,759 | -15437759 |
|
 2013 Toronto Blue Jays