| Player | Pos | Salary | Pct | WARP | WARP/$M | $/WARP | Current Status |
|---|
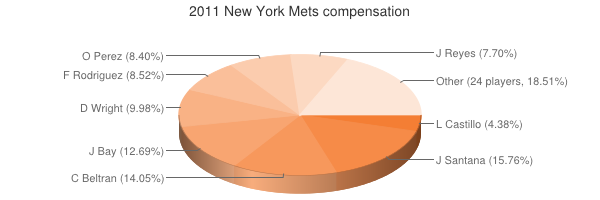
 Johan Santana
 |
DNP |
$22,500,000 |
15.76% |
— |
— |
— |
|
 Carlos Beltrán
 |
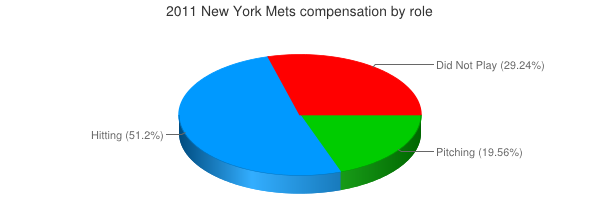
RF |
$20,070,000 |
14.05% |
2.81 |
0.14 |
$7,142,603 |
|
 Jason Bay
 |
LF |
$18,125,000 |
12.69% |
1.07 |
0.06 |
$16,977,332 |
|
 David Wright
 |
3B |
$14,250,000 |
9.98% |
1.29 |
0.09 |
$11,047,711 |
|
 Francisco Rodríguez
 |
RP |
$12,166,667 |
8.52% |
0.10 |
0.01 |
$116,373,981 |
|
 Oliver Pérez
 |
DNP |
$12,000,000 |
8.40% |
— |
— |
— |
|
 José Reyes
 |
SS |
$11,000,000 |
7.70% |
6.38 |
0.58 |
$1,724,833 |
|
 Luis Castillo
 |
DNP |
$6,250,000 |
4.38% |
— |
— |
— |
|
 Mike Pelfrey
 |
RP |
$3,925,000 |
2.75% |
-0.58 |
— |
— |
|
 Ángel Pagán
 |
CF |
$3,500,000 |
2.45% |
2.01 |
0.57 |
$1,745,096 |
|
 R.A. Dickey
 |
RP |
$2,750,000 |
1.93% |
3.15 |
1.15 |
$873,096 |
|
 Ryota Igarashi
 |
RP |
$1,750,000 |
1.23% |
0.20 |
0.12 |
$8,577,464 |
|
 Chris Capuano
 |
RP |
$1,500,000 |
1.05% |
1.73 |
1.15 |
$869,212 |
|
 Ronny Paulino
 |
C |
$1,350,000 |
0.95% |
-0.41 |
— |
— |
|
 D.J. Carrasco
 |
RP |
$1,200,000 |
0.84% |
-0.11 |
— |
— |
|
 Scott Hairston
 |
PH |
$1,100,000 |
0.77% |
0.37 |
0.33 |
$3,012,543 |
|
 Chris Young
 |
RP |
$1,100,000 |
0.77% |
0.26 |
0.24 |
$4,236,994 |
|
 Gary Matthews
 |
DNP |
$1,000,000 |
0.70% |
— |
— |
— |
|
 Tim Byrdak
 |
RP |
$900,000 |
0.63% |
0.54 |
0.60 |
$1,669,793 |
|
 Willie Harris
 |
PH |
$800,000 |
0.56% |
0.25 |
0.31 |
$3,187,759 |
|
 Blaine Boyer
 |
RP |
$725,000 |
0.51% |
-0.23 |
— |
— |
|
 Taylor Buchholz
 |
RP |
$600,000 |
0.42% |
0.03 |
0.05 |
$20,589,689 |
|
 Jonathon Niese
 |
RP |
$452,000 |
0.32% |
2.41 |
5.34 |
$187,313 |
|
 Bobby Parnell
 |
RP |
$433,500 |
0.30% |
1.04 |
2.39 |
$417,835 |
|
 Ike Davis
 |
1B |
$432,000 |
0.30% |
1.67 |
3.87 |
$258,230 |
|
 Daniel Murphy
 |
1B |
$422,000 |
0.30% |
1.82 |
4.31 |
$232,275 |
|
 Josh Thole
 |
C |
$420,000 |
0.29% |
1.89 |
4.49 |
$222,714 |
|
 Chin-lung Hu
 |
PH |
$420,000 |
0.29% |
-0.25 |
— |
— |
|
 Lucas Duda
 |
1B |
$414,000 |
0.29% |
1.82 |
4.39 |
$227,891 |
|
 Mike Nickeas
 |
C |
$414,000 |
0.29% |
0.06 |
0.16 |
$6,450,879 |
|
 Brad Emaus
 |
2B |
$414,000 |
0.29% |
-0.21 |
— |
— |
|
 Pedro Beato
 |
RP |
$414,000 |
0.29% |
-0.30 |
— |
— |
|
| Player | Pos | Salary | Pct | WARP | WARP/$M | $/WARP | Current Status |
|---|
|
Francisco Rodríguez |
DNP |
$22,500,000 |
15.76% |
-0.58 | 0.14 | $116,373,981 |
|
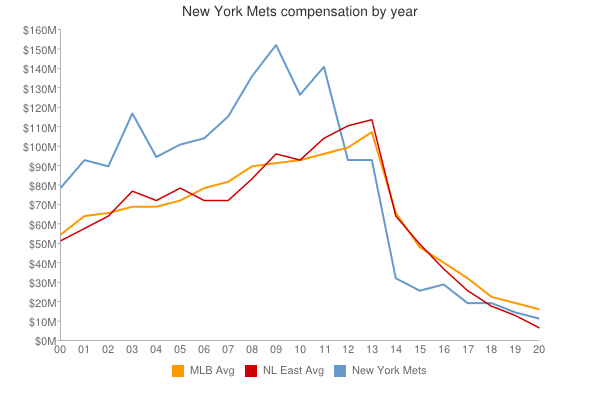
| Year | Mets payroll | Avg payroll | Diff |
|---|
| 1992 | $2,950,000 | $2,356,071 | $593,929 |
| 1993 | $3,000,000 | $3,410,000 | $-410,000 |
| 1994 | $3,883,333 | $3,911,904 | $-28,571 |
| 1995 | $4,883,333 | $5,208,333 | $-325,000 |
| 1996 | $5,133,333 | $4,583,416 | $549,917 |
| 1999 | $8,871,429 | $7,867,823 | $1,003,606 |
| 2000 | $79,449,762 | $56,164,089 | $23,285,673 |
| 2001 | $93,043,928 | $65,991,638 | $27,052,290 |
| 2002 | $91,995,260 | $68,244,471 | $23,750,789 |
| 2003 | $117,324,763 | $71,318,479 | $46,006,284 |
| 2004 | $95,283,804 | $70,466,961 | $24,816,843 |
| 2005 | $100,563,370 | $73,264,780 | $27,298,590 |
| 2006 | $102,337,140 | $79,051,754 | $23,285,386 |
| 2007 | $116,683,000 | $83,931,138 | $32,751,862 |
| 2008 | $137,759,000 | $90,812,373 | $46,946,627 |
| 2009 | $153,550,596 | $91,093,211 | $62,457,385 |
| 2010 | $127,098,096 | $93,373,681 | $33,724,415 |
| 2011 | $142,797,167 | $96,102,034 | $46,695,133 |
| 2012 | $94,508,922 | $100,657,138 | $-6,148,216 |
| 2013 | $93,684,590 | $109,024,990 | $-15,340,400 |
| 2014 | $84,951,365 | $117,828,782 | $-32,877,417 |
| 2015 | $101,344,283 | $127,404,244 | $-26,059,961 |
| 2016 | $135,188,085 | $132,219,407 | $2,968,678 |
| 2017 | $154,437,460 | $137,302,894 | $17,134,566 |
| 2018 | $150,558,844 | $136,929,168 | $13,629,676 |
| 2019 | $157,052,231 | $136,944,257 | $20,107,974 |
| 2020 | $170,725,429 | $140,677,788 | $30,047,641 |
| 2021 | $215,623,963 | $132,162,631 | $83,461,332 |
| 2022 | $278,683,333 | $149,374,046 | $129,309,287 |
| 2023 | $359,669,166 | $160,460,390 | $199,208,776 |
| 2024 | $286,854,409 | $135,504,022 | $151,350,387 |
| 2025 | $138,459,294 | $96,417,302 | $42,041,992 |
| 2026 | $101,577,765 | $76,694,120 | $24,883,645 |
| 2027 | $87,827,765 | $58,935,617 | $28,892,148 |
| 2028 | $54,600,000 | $45,437,759 | $9,162,241 |
| 2029 | $54,600,000 | $37,269,628 | $17,330,372 |
| 2030 | $54,600,000 | $39,665,769 | $14,934,231 |
| 2031 | $34,100,000 | $38,360,152 | $-4,260,152 |
| Year | Mets payroll | Avg payroll | Diff |
|---|
| 1992 | $117,324,763 | $100,657,138 | $-15,340,400 | |
 2011 New York Mets