| Player | Pos | Salary | Pct | WARP | WARP/$M | $/WARP | Current Status |
|---|
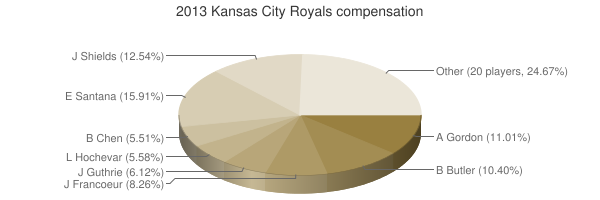
 Ervin Santana
 |
RP |
$13,000,000 |
15.91% |
3.17 |
0.24 |
$4,107,036 |
|
 James Shields
 |
RP |
$10,250,000 |
12.54% |
3.93 |
0.38 |
$2,606,730 |
|
 Alex Gordon
 |
LF |
$9,000,000 |
11.01% |
4.71 |
0.52 |
$1,910,694 |
|
 Billy Butler
 |
DH |
$8,500,000 |
10.40% |
1.63 |
0.19 |
$5,201,608 |
|
 Jeff Francoeur
 |
RF |
$6,750,000 |
8.26% |
-0.97 |
— |
— |
|
 Jeremy Guthrie
 |
RP |
$5,000,000 |
6.12% |
-1.37 |
— |
— |
|
 Luke Hochevar
 |
RP |
$4,560,000 |
5.58% |
1.74 |
0.38 |
$2,613,285 |
|
 Bruce Chen
 |
RP |
$4,500,000 |
5.51% |
-0.36 |
— |
— |
|
 Alcides Escobar
 |
SS |
$3,000,000 |
3.67% |
-0.69 |
— |
— |
|
 Wade Davis
 |
RP |
$2,800,000 |
3.43% |
-0.25 |
— |
— |
|
 Felipe Paulino
 |
DNP |
$1,750,000 |
2.14% |
— |
— |
— |
|
 Noel Arguelles
 |
DNP |
$1,380,000 |
1.69% |
— |
— |
— |
|
 Aaron Crow
 |
RP |
$1,280,000 |
1.57% |
-0.04 |
— |
— |
|
 Miguel Tejada
 |
2B |
$1,100,000 |
1.35% |
0.13 |
0.12 |
$8,379,037 |
|
 Chris Getz
 |
2B |
$1,050,000 |
1.28% |
-0.26 |
— |
— |
|
 George Kottaras
 |
C |
$1,000,000 |
1.22% |
0.09 |
0.09 |
$11,660,869 |
|
 Salvador Perez
 |
C |
$1,000,000 |
1.22% |
3.48 |
3.48 |
$287,354 |
|
 Brett Hayes
 |
C |
$600,000 |
0.73% |
0.08 |
0.13 |
$7,465,630 |
|
 Greg Holland
 |
RP |
$539,500 |
0.66% |
2.21 |
4.09 |
$244,600 |
|
 Tim Collins
 |
RP |
$534,500 |
0.65% |
0.43 |
0.80 |
$1,247,578 |
|
 Luis Mendoza
 |
RP |
$532,000 |
0.65% |
-1.13 |
— |
— |
|
 Eric Hosmer
 |
1B |
$528,250 |
0.65% |
3.70 |
7.00 |
$142,950 |
|
 Mike Moustakas
 |
3B |
$524,500 |
0.64% |
0.52 |
1.00 |
$1,003,150 |
|
 Elliot Johnson
 |
2B |
$520,500 |
0.64% |
-0.68 |
— |
— |
|
 Kelvin Herrera
 |
RP |
$508,175 |
0.62% |
1.31 |
2.57 |
$388,965 |
|
 Jarrod Dyson
 |
CF |
$506,000 |
0.62% |
0.95 |
1.88 |
$532,391 |
|
 Danny Duffy
 |
RP |
$505,125 |
0.62% |
-0.27 |
— |
— |
|
 Lorenzo Cain
 |
CF |
$503,175 |
0.62% |
1.48 |
2.94 |
$340,579 |
|
| Player | Pos | Salary | Pct | WARP | WARP/$M | $/WARP | Current Status |
|---|
|
Alcides Escobar |
DNP |
$13,000,000 |
15.91% |
-0.97 | 0.24 | $11,660,869 |
|
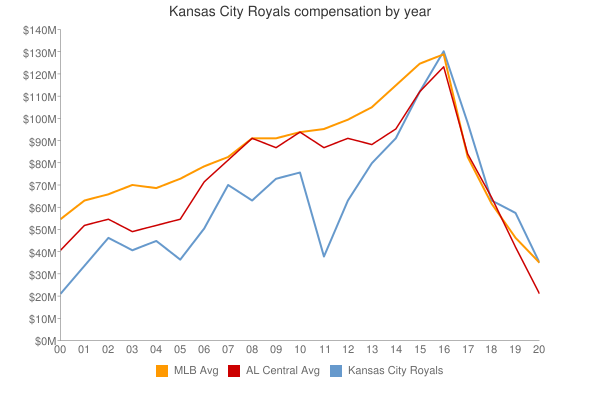
| Year | Royals payroll | Avg payroll | Diff |
|---|
| 1984 | $40,000 | $260,000 | $-220,000 |
| 1985 | $150,000 | $437,500 | $-287,500 |
| 1986 | $925,000 | $552,000 | $373,000 |
| 1987 | $740,000 | $589,500 | $150,500 |
| 1988 | $1,100,000 | $732,083 | $367,917 |
| 1989 | $1,250,000 | $862,714 | $387,286 |
| 1990 | $1,375,000 | $1,203,571 | $171,429 |
| 1991 | $2,950,000 | $1,884,642 | $1,065,358 |
| 1997 | $175,000 | $4,892,222 | $-4,717,222 |
| 1998 | $230,000 | $6,661,904 | $-6,431,904 |
| 1999 | $460,000 | $7,867,823 | $-7,407,823 |
| 2000 | $22,835,500 | $57,491,092 | $-34,655,592 |
| 2001 | $34,805,000 | $67,120,750 | $-32,315,750 |
| 2002 | $47,427,000 | $69,204,705 | $-21,777,705 |
| 2003 | $41,268,000 | $72,156,639 | $-30,888,639 |
| 2004 | $46,671,500 | $71,426,357 | $-24,754,857 |
| 2005 | $37,882,000 | $73,628,169 | $-35,746,169 |
| 2006 | $51,655,500 | $81,192,832 | $-29,537,332 |
| 2007 | $70,227,500 | $85,747,487 | $-15,519,987 |
| 2008 | $63,830,500 | $93,079,041 | $-29,248,541 |
| 2009 | $77,970,833 | $92,957,049 | $-14,986,216 |
| 2010 | $76,260,210 | $94,957,956 | $-18,697,746 |
| 2011 | $39,506,000 | $97,426,414 | $-57,920,414 |
| 2012 | $64,485,350 | $100,689,500 | $-36,204,150 |
| 2013 | $81,721,725 | $106,658,387 | $-24,936,662 |
| 2014 | $92,185,521 | $115,428,670 | $-23,243,149 |
| 2015 | $112,857,025 | $125,458,486 | $-12,601,461 |
| 2016 | $131,487,125 | $130,290,910 | $1,196,215 |
| 2017 | $139,555,817 | $136,573,000 | $2,982,817 |
| 2018 | $124,733,117 | $135,681,867 | $-10,948,750 |
| 2019 | $96,470,066 | $134,776,225 | $-38,306,159 |
| 2020 | $84,548,842 | $138,321,485 | $-53,772,643 |
| 2021 | $83,438,450 | $129,635,938 | $-46,197,488 |
| 2022 | $94,832,900 | $147,002,411 | $-52,169,511 |
| 2023 | $83,968,100 | $158,155,877 | $-74,187,777 |
| 2024 | $77,773,611 | $133,074,721 | $-55,301,110 |
| 2025 | $57,111,111 | $94,180,059 | $-37,068,948 |
| 2026 | $16,111,111 | $74,818,461 | $-58,707,350 |
| 2027 | $20,111,111 | $56,972,319 | $-36,861,208 |
| 2028 | $31,111,111 | $45,437,759 | $-14,326,648 |
| 2029 | $36,111,111 | $37,269,628 | $-1,158,517 |
| 2030 | $36,111,111 | $39,665,769 | $-3,554,658 |
| 2031 | $35,000,000 | $38,360,152 | $-3,360,152 |
| 2032 | $35,000,000 | $47,925,459 | $-12,925,459 |
| 2033 | $35,000,000 | $43,068,924 | $-8,068,924 |
| 2034 | $35,000,000 | $29,428,571 | $5,571,429 |
| Year | Royals payroll | Avg payroll | Diff |
|---|
| 1984 | $112,857,025 | $100,689,500 | $-34,655,592 | |
 2013 Kansas City Royals