| Player | Pos | Salary | Pct | WARP | WARP/$M | $/WARP | Current Status |
|---|
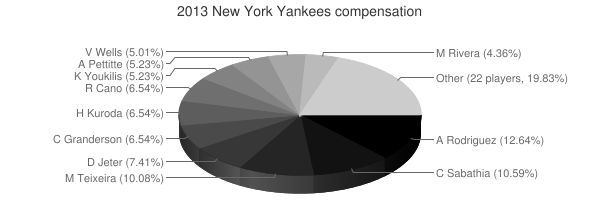
 Alex Rodriguez
 |
3B |
$29,000,000 |
12.64% |
0.65 |
0.02 |
$44,434,094 |
|
 CC Sabathia
 |
RP |
$24,285,714 |
10.59% |
1.49 |
0.06 |
$16,312,055 |
|
 Mark Teixeira
 |
1B |
$23,125,000 |
10.08% |
-0.07 |
— |
— |
|
 Derek Jeter
 |
SS |
$17,000,000 |
7.41% |
-0.33 |
— |
— |
|
 Hiroki Kuroda
 |
RP |
$15,000,000 |
6.54% |
1.76 |
0.12 |
$8,509,721 |
|
 Robinson Canó
 |
2B |
$15,000,000 |
6.54% |
6.04 |
0.40 |
$2,484,275 |
|
 Curtis Granderson
 |
CF |
$15,000,000 |
6.54% |
0.71 |
0.05 |
$21,104,586 |
|
 Kevin Youkilis
 |
3B |
$12,000,000 |
5.23% |
-0.36 |
— |
— |
|
 Andy Pettitte
 |
RP |
$12,000,000 |
5.23% |
0.26 |
0.02 |
$46,994,322 |
|
 Vernon Wells
 |
LF |
$11,500,000 |
5.01% |
0.91 |
0.08 |
$12,664,919 |
|
 Mariano Rivera
 |
RP |
$10,000,000 |
4.36% |
1.35 |
0.13 |
$7,415,812 |
|
 A.J. Burnett
 |
DNP |
$8,500,000 |
3.71% |
— |
— |
— |
|
 Phil Hughes
 |
RP |
$7,150,000 |
3.12% |
-1.43 |
— |
— |
|
 Ichiro Suzuki
 |
RF |
$6,500,000 |
2.83% |
-0.26 |
— |
— |
|
 Boone Logan
 |
RP |
$3,150,000 |
1.37% |
1.05 |
0.33 |
$3,009,027 |
|
 David Robertson
 |
RP |
$3,100,000 |
1.35% |
1.87 |
0.60 |
$1,659,840 |
|
 Brett Gardner
 |
CF |
$2,850,000 |
1.24% |
2.37 |
0.83 |
$1,200,227 |
|
 Travis Hafner
 |
DH |
$2,000,000 |
0.87% |
0.02 |
0.01 |
$86,853,808 |
|
 Joba Chamberlain
 |
RP |
$1,875,000 |
0.82% |
0.05 |
0.03 |
$35,218,477 |
|
 Brennan Boesch
 |
RF |
$1,500,000 |
0.65% |
0.14 |
0.10 |
$10,362,336 |
|
 Lyle Overbay
 |
1B |
$1,250,000 |
0.54% |
-0.39 |
— |
— |
|
 Ben Francisco
 |
DH |
$1,100,000 |
0.48% |
-0.46 |
— |
— |
|
 Shawn Kelley
 |
RP |
$935,000 |
0.41% |
0.44 |
0.47 |
$2,133,739 |
|
 Jayson Nix
 |
SS |
$900,000 |
0.39% |
1.43 |
1.59 |
$629,437 |
|
 Iván Nova
 |
RP |
$575,600 |
0.25% |
0.91 |
1.58 |
$634,732 |
|
 Eduardo Núñez
 |
SS |
$533,300 |
0.23% |
-0.17 |
— |
— |
|
 Michael Pineda
 |
DNP |
$528,475 |
0.23% |
— |
— |
— |
|
 Francisco Cervelli
 |
C |
$515,350 |
0.22% |
1.17 |
2.27 |
$441,032 |
|
 Chris Stewart
 |
C |
$515,100 |
0.22% |
2.39 |
4.64 |
$215,466 |
|
 David Phelps
 |
RP |
$512,425 |
0.22% |
0.67 |
1.30 |
$767,998 |
|
 Cody Eppley
 |
RP |
$510,350 |
0.22% |
0.02 |
0.04 |
$23,066,250 |
|
 Adam Warren
 |
RP |
$490,525 |
0.21% |
-0.05 |
— |
— |
|
 Cesar Cabral
 |
RP |
$490,000 |
0.21% |
0.12 |
0.25 |
$4,009,590 |
|
| Player | Pos | Salary | Pct | WARP | WARP/$M | $/WARP | Current Status |
|---|
|
Francisco Cervelli |
DNP |
$29,000,000 |
12.64% |
-0.07 | 0.02 | $44,434,094 |
|
| Year | Yankees payroll | Avg payroll | Diff |
|---|
| 1985 | $1,470,000 | $437,500 | $1,032,500 |
| 1986 | $1,570,000 | $552,000 | $1,018,000 |
| 1987 | $1,670,000 | $589,500 | $1,080,500 |
| 1988 | $1,770,000 | $732,083 | $1,037,917 |
| 1989 | $2,120,000 | $862,714 | $1,257,286 |
| 2000 | $92,327,810 | $57,491,092 | $34,836,718 |
| 2001 | $111,161,143 | $67,120,750 | $44,040,393 |
| 2002 | $126,288,583 | $69,204,705 | $57,083,878 |
| 2003 | $153,774,814 | $72,156,639 | $81,618,175 |
| 2004 | $185,863,817 | $71,426,357 | $114,437,460 |
| 2005 | $209,668,914 | $73,628,169 | $136,040,745 |
| 2006 | $201,304,171 | $81,192,832 | $120,111,339 |
| 2007 | $195,601,007 | $85,747,487 | $109,853,520 |
| 2008 | $213,493,346 | $93,079,041 | $120,414,305 |
| 2009 | $203,275,189 | $92,957,049 | $110,318,140 |
| 2010 | $212,105,889 | $94,957,956 | $117,147,933 |
| 2011 | $207,447,964 | $97,426,414 | $110,021,550 |
| 2012 | $213,098,614 | $100,689,500 | $112,409,114 |
| 2013 | $229,391,839 | $106,658,387 | $122,733,452 |
| 2014 | $198,516,324 | $115,428,670 | $83,087,654 |
| 2015 | $217,758,571 | $125,458,486 | $92,300,085 |
| 2016 | $227,854,350 | $130,290,910 | $97,563,440 |
| 2017 | $196,389,700 | $136,573,000 | $59,816,700 |
| 2018 | $166,111,632 | $135,681,867 | $30,429,765 |
| 2019 | $203,897,446 | $134,776,225 | $69,121,221 |
| 2020 | $243,778,988 | $138,321,485 | $105,457,503 |
| 2021 | $211,495,764 | $129,635,938 | $81,859,826 |
| 2022 | $250,208,214 | $147,002,411 | $103,205,803 |
| 2023 | $271,811,172 | $158,155,877 | $113,655,295 |
| 2024 | $232,094,047 | $133,074,721 | $99,019,326 |
| 2025 | $185,119,047 | $94,180,059 | $90,938,988 |
| 2026 | $148,833,333 | $74,818,461 | $74,014,872 |
| 2027 | $128,833,333 | $56,972,319 | $71,861,014 |
| 2028 | $113,833,333 | $45,437,759 | $68,395,574 |
| 2029 | $40,000,000 | $37,269,628 | $2,730,372 |
| 2030 | $40,000,000 | $39,665,769 | $334,231 |
| 2031 | $40,000,000 | $38,360,152 | $1,639,848 |
| Year | Yankees payroll | Avg payroll | Diff |
|---|
| 1985 | $111,161,143 | $100,689,500 | $114,437,460 | |
 2013 New York Yankees