| Player | Pos | Salary | Pct | WARP | WARP/$M | $/WARP | Current Status |
|---|
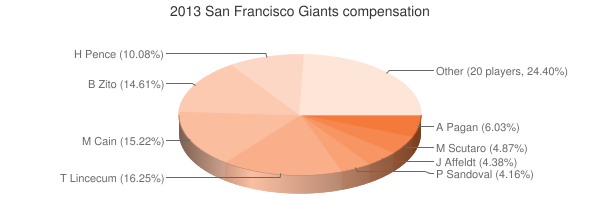
 Tim Lincecum
 |
RP |
$22,250,000 |
16.25% |
2.91 |
0.13 |
$7,653,386 |
|
 Matt Cain
 |
RP |
$20,833,333 |
15.22% |
3.49 |
0.17 |
$5,963,968 |
|
 Barry Zito
 |
RP |
$20,000,000 |
14.61% |
-0.36 |
— |
— |
|
 Hunter Pence
 |
RF |
$13,800,000 |
10.08% |
4.84 |
0.35 |
$2,851,334 |
|
 Ángel Pagán
 |
CF |
$8,250,000 |
6.03% |
1.28 |
0.16 |
$6,448,839 |
|
 Marco Scutaro
 |
2B |
$6,666,667 |
4.87% |
2.01 |
0.30 |
$3,321,310 |
|
 Jeremy Affeldt
 |
RP |
$6,000,000 |
4.38% |
-0.57 |
— |
— |
|
 Pablo Sandoval
 |
3B |
$5,700,000 |
4.16% |
0.40 |
0.07 |
$14,194,075 |
|
 Ryan Vogelsong
 |
RP |
$5,000,000 |
3.65% |
-0.63 |
— |
— |
|
 Santiago Casilla
 |
RP |
$4,500,000 |
3.29% |
0.58 |
0.13 |
$7,705,136 |
|
 Javier López
 |
RP |
$4,250,000 |
3.10% |
0.66 |
0.16 |
$6,421,142 |
|
 Buster Posey
 |
C |
$3,777,777 |
2.76% |
6.49 |
1.72 |
$582,089 |
|
 Sergio Romo
 |
RP |
$3,500,000 |
2.56% |
1.57 |
0.45 |
$2,232,997 |
|
 Andres Torres
 |
LF |
$2,000,000 |
1.46% |
0.23 |
0.12 |
$8,599,118 |
|
 Jose Mijares
 |
RP |
$1,800,000 |
1.31% |
0.45 |
0.25 |
$3,967,047 |
|
 Grégor Blanco
 |
CF |
$1,350,000 |
0.99% |
0.76 |
0.56 |
$1,780,859 |
|
 Madison Bumgarner
 |
RP |
$950,000 |
0.69% |
5.62 |
5.91 |
$169,119 |
|
 Joaquin Arias
 |
3B |
$925,000 |
0.68% |
-0.08 |
— |
— |
|
 Chad Gaudin
 |
RP |
$750,000 |
0.55% |
1.37 |
1.83 |
$545,502 |
|
 Guillermo Quiroz
 |
C |
$575,000 |
0.42% |
-0.52 |
— |
— |
|
 Brandon Belt
 |
1B |
$531,500 |
0.39% |
4.38 |
8.24 |
$121,324 |
|
 Brandon Crawford
 |
SS |
$530,000 |
0.39% |
1.56 |
2.95 |
$339,115 |
|
 Héctor Sánchez
 |
C |
$502,500 |
0.37% |
0.27 |
0.55 |
$1,831,288 |
|
 Tony Abreu
 |
2B |
$498,000 |
0.36% |
0.09 |
0.18 |
$5,486,165 |
|
 George Kontos
 |
RP |
$494,500 |
0.36% |
-0.07 |
— |
— |
|
 Brett Pill
 |
PH |
$494,000 |
0.36% |
0.06 |
0.12 |
$8,432,696 |
|
 Eric Surkamp
 |
RP |
$490,500 |
0.36% |
-0.12 |
— |
— |
|
 Nick Noonan
 |
PH |
$490,000 |
0.36% |
-0.52 |
— |
— |
|
| Player | Pos | Salary | Pct | WARP | WARP/$M | $/WARP | Current Status |
|---|
|
Madison Bumgarner |
RP |
$22,250,000 |
16.25% |
-0.36 | 0.13 | $14,194,075 |
|
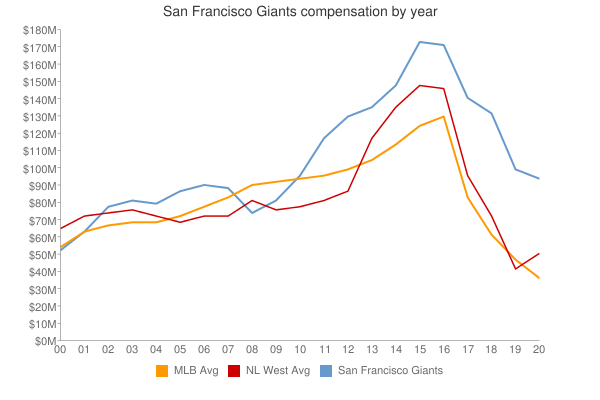
| Year | Giants payroll | Avg payroll | Diff |
|---|
| 2000 | $53,342,826 | $57,491,092 | $-4,148,266 |
| 2001 | $63,289,167 | $67,120,750 | $-3,831,583 |
| 2002 | $78,514,835 | $69,204,705 | $9,310,130 |
| 2003 | $81,302,167 | $72,156,639 | $9,145,528 |
| 2004 | $80,400,833 | $71,426,357 | $8,974,476 |
| 2005 | $88,848,833 | $73,628,169 | $15,220,664 |
| 2006 | $90,017,671 | $81,192,832 | $8,824,839 |
| 2007 | $89,691,052 | $85,747,487 | $3,943,565 |
| 2008 | $75,877,000 | $93,079,041 | $-17,202,041 |
| 2009 | $82,566,450 | $92,957,049 | $-10,390,599 |
| 2010 | $97,023,833 | $94,957,956 | $2,065,877 |
| 2011 | $118,198,333 | $97,426,414 | $20,771,919 |
| 2012 | $131,980,298 | $100,689,500 | $31,290,798 |
| 2013 | $136,908,777 | $106,658,387 | $30,250,390 |
| 2014 | $149,439,474 | $115,428,670 | $34,010,804 |
| 2015 | $173,179,277 | $125,458,486 | $47,720,791 |
| 2016 | $172,086,611 | $130,290,910 | $41,795,701 |
| 2017 | $180,822,611 | $136,573,000 | $44,249,611 |
| 2018 | $200,505,278 | $135,681,867 | $64,823,411 |
| 2019 | $170,179,653 | $134,776,225 | $35,403,428 |
| 2020 | $155,190,747 | $138,321,485 | $16,869,262 |
| 2021 | $149,344,778 | $129,635,938 | $19,708,840 |
| 2022 | $166,189,000 | $147,002,411 | $19,186,589 |
| 2023 | $189,262,500 | $158,155,877 | $31,106,623 |
| 2024 | $189,387,903 | $133,074,721 | $56,313,182 |
| 2025 | $135,000,000 | $94,180,059 | $40,819,941 |
| 2026 | $93,750,000 | $74,818,461 | $18,931,539 |
| 2027 | $35,500,000 | $56,972,319 | $-21,472,319 |
| 2028 | $24,000,000 | $45,437,759 | $-21,437,759 |
| Year | Giants payroll | Avg payroll | Diff |
|---|
| 2000 | $118,198,333 | $100,689,500 | $-17,202,041 | |
 2013 San Francisco Giants