| Player | Pos | Salary | Pct | WARP | WARP/$M | $/WARP | Current Status |
|---|
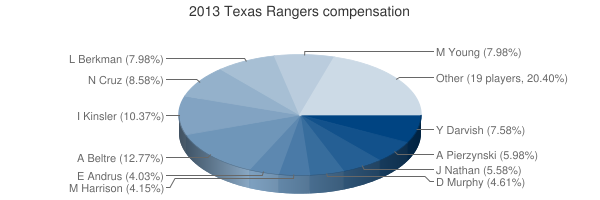
 Adrián Beltré
 |
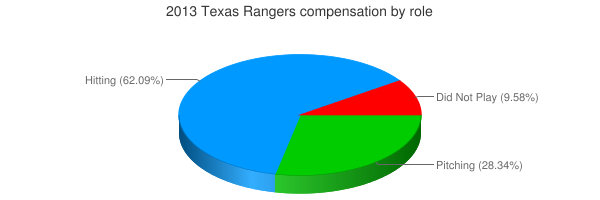
3B |
$16,000,000 |
12.77% |
5.64 |
0.35 |
$2,834,532 |
|
 Ian Kinsler
 |
2B |
$13,000,000 |
10.37% |
5.34 |
0.41 |
$2,435,424 |
|
 Nelson Cruz
 |
RF |
$10,750,000 |
8.58% |
1.63 |
0.15 |
$6,596,711 |
|
 Michael Young
 |
DNP |
$10,000,000 |
7.98% |
— |
— |
— |
|
 Lance Berkman
 |
DH |
$10,000,000 |
7.98% |
-0.18 |
— |
— |
|
 Yu Darvish
 |
RP |
$9,500,000 |
7.58% |
6.07 |
0.64 |
$1,564,031 |
|
 A.J. Pierzynski
 |
C |
$7,500,000 |
5.98% |
1.24 |
0.16 |
$6,068,894 |
|
 Joe Nathan
 |
RP |
$7,000,000 |
5.58% |
1.31 |
0.19 |
$5,361,520 |
|
 David Murphy
 |
LF |
$5,775,000 |
4.61% |
-0.52 |
— |
— |
|
 Matt Harrison
 |
RP |
$5,200,000 |
4.15% |
-0.02 |
— |
— |
|
 Elvis Andrus
 |
SS |
$5,050,000 |
4.03% |
2.36 |
0.47 |
$2,139,948 |
|
 Leonys Martin
 |
CF |
$3,250,000 |
2.59% |
2.32 |
0.72 |
$1,398,313 |
|
 Derek Holland
 |
RP |
$3,200,000 |
2.55% |
2.34 |
0.73 |
$1,368,703 |
|
 Neftalí Feliz
 |
RP |
$2,900,000 |
2.31% |
0.00 |
0.00 |
$3,917,240,858 |
|
 Geovany Soto
 |
C |
$2,750,000 |
2.19% |
1.40 |
0.51 |
$1,966,477 |
|
 Colby Lewis
 |
DNP |
$2,000,000 |
1.60% |
— |
— |
— |
|
 Joakim Soria
 |
RP |
$2,000,000 |
1.60% |
0.56 |
0.28 |
$3,556,510 |
|
 Jeff Baker
 |
LF |
$1,750,000 |
1.40% |
0.83 |
0.47 |
$2,105,481 |
|
 Jason Frasor
 |
RP |
$1,500,000 |
1.20% |
0.85 |
0.57 |
$1,765,742 |
|
 Derek Lowe
 |
RP |
$1,250,000 |
1.00% |
-0.10 |
— |
— |
|
 Alexi Ogando
 |
RP |
$506,600 |
0.40% |
-0.30 |
— |
— |
|
 Mitch Moreland
 |
1B |
$502,700 |
0.40% |
1.14 |
2.27 |
$441,143 |
|
 Craig Gentry
 |
CF |
$501,000 |
0.40% |
3.30 |
6.58 |
$151,979 |
|
 Robbie Ross Jr.
 |
RP |
$497,400 |
0.40% |
0.47 |
0.95 |
$1,057,623 |
|
 Julio Borbon
 |
DH |
$496,000 |
0.40% |
-0.03 |
— |
— |
|
 Michael Kirkman
 |
RP |
$495,800 |
0.40% |
-0.18 |
— |
— |
|
 Tanner Scheppers
 |
RP |
$493,600 |
0.39% |
-0.24 |
— |
— |
|
 Martín Pérez
 |
RP |
$492,000 |
0.39% |
1.42 |
2.89 |
$345,911 |
|
 Joe Ortiz
 |
RP |
$490,000 |
0.39% |
-0.00 |
— |
— |
|
 Leury García
 |
2B |
$490,000 |
0.39% |
-0.23 |
— |
— |
|
| Player | Pos | Salary | Pct | WARP | WARP/$M | $/WARP | Current Status |
|---|
|
Tanner Scheppers |
DNP |
$16,000,000 |
12.77% |
-0.18 | 0.35 | $3,917,240,858 |
|
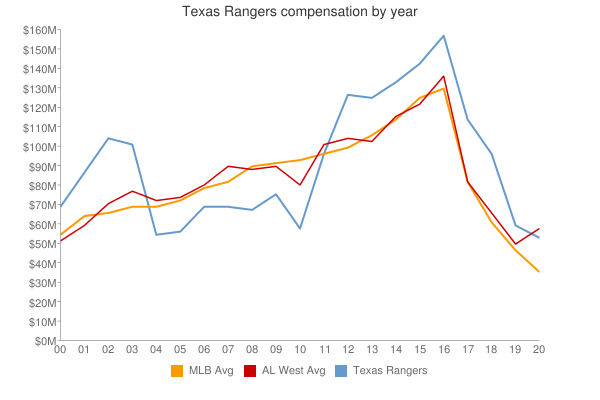
| Year | Rangers payroll | Avg payroll | Diff |
|---|
| 2000 | $69,920,921 | $57,491,092 | $12,429,829 |
| 2001 | $87,819,000 | $67,120,750 | $20,698,250 |
| 2002 | $105,876,122 | $69,204,705 | $36,671,417 |
| 2003 | $102,531,667 | $72,156,639 | $30,375,028 |
| 2004 | $55,302,917 | $71,426,357 | $-16,123,440 |
| 2005 | $56,670,500 | $73,628,169 | $-16,957,669 |
| 2006 | $68,894,360 | $81,192,832 | $-12,298,472 |
| 2007 | $70,934,240 | $85,747,487 | $-14,813,247 |
| 2008 | $68,081,980 | $93,079,041 | $-24,997,061 |
| 2009 | $76,255,380 | $92,957,049 | $-16,701,669 |
| 2010 | $58,490,000 | $94,957,956 | $-36,467,956 |
| 2011 | $96,713,370 | $97,426,414 | $-713,044 |
| 2012 | $127,289,900 | $100,689,500 | $26,600,400 |
| 2013 | $125,340,100 | $106,658,387 | $18,681,713 |
| 2014 | $133,525,939 | $115,428,670 | $18,097,269 |
| 2015 | $143,733,540 | $125,458,486 | $18,275,054 |
| 2016 | $150,955,390 | $130,290,910 | $20,664,480 |
| 2017 | $165,348,063 | $136,573,000 | $28,775,063 |
| 2018 | $133,137,626 | $135,681,867 | $-2,544,241 |
| 2019 | $118,274,435 | $134,776,225 | $-16,501,790 |
| 2020 | $151,058,666 | $138,321,485 | $12,737,181 |
| 2021 | $96,241,250 | $129,635,938 | $-33,394,688 |
| 2022 | $143,943,834 | $147,002,411 | $-3,058,577 |
| 2023 | $196,608,190 | $158,155,877 | $38,452,313 |
| 2024 | $195,275,000 | $133,074,721 | $62,200,279 |
| 2025 | $138,750,000 | $94,180,059 | $44,569,941 |
| 2026 | $95,500,000 | $74,818,461 | $20,681,539 |
| 2027 | $94,500,000 | $56,972,319 | $37,527,681 |
| 2028 | $51,500,000 | $45,437,759 | $6,062,241 |
| 2029 | $31,500,000 | $37,269,628 | $-5,769,628 |
| 2030 | $31,500,000 | $39,665,769 | $-8,165,769 |
| 2031 | $31,500,000 | $38,360,152 | $-6,860,152 |
| Year | Rangers payroll | Avg payroll | Diff |
|---|
| 2000 | $105,876,122 | $100,689,500 | $-16,123,440 | |
 2013 Texas Rangers