| Player | Pos | Salary | Pct | WARP | WARP/$M | $/WARP | Current Status |
|---|
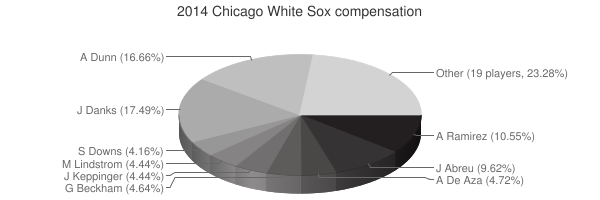
 John Danks
 |
RP |
$15,750,000 |
17.49% |
-2.46 |
— |
— |
|
 Adam Dunn
 |
DH |
$15,000,000 |
16.66% |
0.72 |
0.05 |
$20,692,309 |
|
 Alexei Ramirez
 |
SS |
$9,500,000 |
10.55% |
3.45 |
0.36 |
$2,757,348 |
|
 José Abreu
 |
1B |
$8,666,666 |
9.62% |
5.89 |
0.68 |
$1,471,066 |
|
 Alejandro De Aza
 |
LF |
$4,250,000 |
4.72% |
0.57 |
0.13 |
$7,469,087 |
|
 Gordon Beckham
 |
2B |
$4,175,000 |
4.64% |
0.39 |
0.09 |
$10,762,639 |
|
 Matt Lindstrom
 |
RP |
$4,000,000 |
4.44% |
0.20 |
0.05 |
$19,973,435 |
|
 Jeff Keppinger
 |
DNP |
$4,000,000 |
4.44% |
— |
— |
— |
|
 Scott Downs
 |
RP |
$3,750,000 |
4.16% |
0.12 |
0.03 |
$30,438,806 |
|
 Chris Sale
 |
RP |
$3,500,000 |
3.89% |
5.08 |
1.45 |
$688,304 |
|
 Ronald Belisario
 |
RP |
$3,000,000 |
3.33% |
-0.46 |
— |
— |
|
 Dayan Viciedo
 |
RF |
$2,800,000 |
3.11% |
-0.77 |
— |
— |
|
 Paul Konerko
 |
DH |
$2,500,000 |
2.78% |
-1.05 |
— |
— |
|
 Felipe Paulino
 |
RP |
$1,500,000 |
1.67% |
-0.66 |
— |
— |
|
 Tyler Flowers
 |
C |
$950,000 |
1.05% |
2.36 |
2.48 |
$402,768 |
|
 José Quintana
 |
RP |
$850,000 |
0.94% |
2.64 |
3.10 |
$322,087 |
|
 Nate Jones
 |
RP |
$545,000 |
0.61% |
-0.16 |
— |
— |
|
 Donnie Veal
 |
RP |
$516,000 |
0.57% |
-0.16 |
— |
— |
|
 Conor Gillaspie
 |
3B |
$512,000 |
0.57% |
1.85 |
3.61 |
$277,025 |
|
 Adam Eaton
 |
CF |
$511,000 |
0.57% |
3.26 |
6.37 |
$156,980 |
|
 Avisaíl García
 |
RF |
$510,000 |
0.57% |
0.02 |
0.03 |
$31,901,917 |
|
 Leury García
 |
3B |
$505,500 |
0.56% |
-1.35 |
— |
— |
|
 Maikel Cleto
 |
RP |
$501,000 |
0.56% |
-0.31 |
— |
— |
|
 Daniel Webb
 |
RP |
$500,000 |
0.56% |
-0.40 |
— |
— |
|
 Erik Johnson
 |
RP |
$500,000 |
0.56% |
-0.35 |
— |
— |
|
 Marcus Semien
 |
3B |
$500,000 |
0.56% |
0.64 |
1.28 |
$784,108 |
|
 Adrian Nieto
 |
C |
$500,000 |
0.56% |
-0.59 |
— |
— |
|
 Mitchell Boggs
 |
DNP |
$270,492 |
0.30% |
— |
— |
— |
|
| Player | Pos | Salary | Pct | WARP | WARP/$M | $/WARP | Current Status |
|---|
|
Alejandro De Aza |
DNP |
$15,750,000 |
17.49% |
-2.46 | 0.05 | $20,692,309 |
|
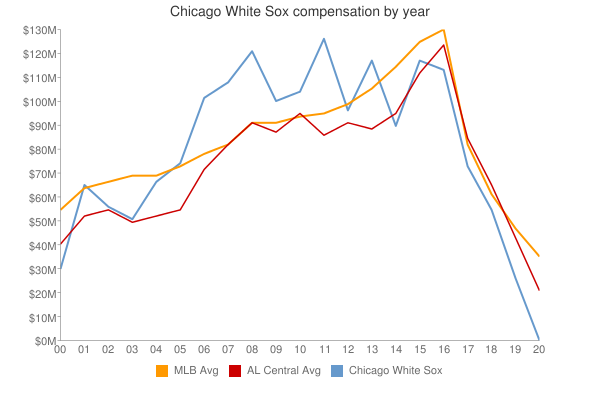
| Year | White Sox payroll | Avg payroll | Diff |
|---|
| 2000 | $31,006,000 | $57,491,092 | $-26,485,092 |
| 2001 | $65,906,167 | $67,120,750 | $-1,214,583 |
| 2002 | $57,757,833 | $69,204,705 | $-11,446,872 |
| 2003 | $51,180,000 | $72,156,639 | $-20,976,639 |
| 2004 | $67,812,500 | $71,426,357 | $-3,613,857 |
| 2005 | $75,695,000 | $73,628,169 | $2,066,831 |
| 2006 | $102,175,667 | $81,192,832 | $20,982,835 |
| 2007 | $108,956,833 | $85,747,487 | $23,209,346 |
| 2008 | $121,250,167 | $93,079,041 | $28,171,126 |
| 2009 | $98,473,500 | $92,957,049 | $5,516,451 |
| 2010 | $102,780,000 | $94,957,956 | $7,822,044 |
| 2011 | $127,789,000 | $97,426,414 | $30,362,586 |
| 2012 | $97,669,500 | $100,689,500 | $-3,020,000 |
| 2013 | $118,914,500 | $106,658,387 | $12,256,113 |
| 2014 | $90,062,658 | $115,428,670 | $-25,366,012 |
| 2015 | $118,619,177 | $125,458,486 | $-6,839,309 |
| 2016 | $114,498,667 | $130,290,910 | $-15,792,243 |
| 2017 | $97,823,271 | $136,573,000 | $-38,749,729 |
| 2018 | $71,217,000 | $135,681,867 | $-64,464,867 |
| 2019 | $88,902,000 | $134,776,225 | $-45,874,225 |
| 2020 | $124,215,000 | $138,321,485 | $-14,106,485 |
| 2021 | $130,741,666 | $129,635,938 | $1,105,728 |
| 2022 | $192,156,232 | $147,002,411 | $45,153,821 |
| 2023 | $181,938,668 | $158,155,877 | $23,782,791 |
| 2024 | $97,083,334 | $133,074,721 | $-35,991,387 |
| 2025 | $43,090,000 | $94,180,059 | $-51,090,059 |
| 2026 | $19,100,000 | $74,818,461 | $-55,718,461 |
| 2027 | $15,100,000 | $56,972,319 | $-41,872,319 |
| Year | White Sox payroll | Avg payroll | Diff |
|---|
| 2000 | $102,175,667 | $100,689,500 | $-26,485,092 | |
 2014 Chicago White Sox