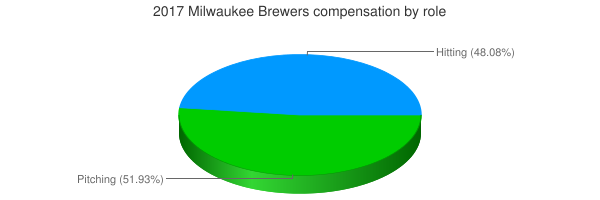
| Player | Pos | Salary | Pct | WARP | WARP/$M | $/WARP | Current Status |
|---|
 Ryan Braun
 |
LF |
$20,000,000 |
31.72% |
1.59 |
0.08 |
$12,566,445 |
|
 Matt Garza
 |
SP |
$12,500,000 |
19.82% |
-0.57 |
— |
— |
|
 Neftalí Feliz
 |
RP |
$5,350,000 |
8.48% |
-0.71 |
— |
— |
|
 Wily Peralta
 |
SP |
$4,275,000 |
6.78% |
-1.19 |
— |
— |
|
 Eric Thames
 |
1B |
$4,000,000 |
6.34% |
2.48 |
0.62 |
$1,613,606 |
|
 Chase Anderson
 |
SP |
$2,450,000 |
3.89% |
2.17 |
0.88 |
$1,131,472 |
|
 Carlos Torres
 |
RP |
$2,175,000 |
3.45% |
0.61 |
0.28 |
$3,551,391 |
|
 Tommy Milone
 |
SP |
$1,250,000 |
1.98% |
-0.21 |
— |
— |
|
 Jared Hughes
 |
RP |
$950,000 |
1.51% |
-0.46 |
— |
— |
|
 Kirk Nieuwenhuis
 |
PH |
$900,000 |
1.43% |
-0.16 |
— |
— |
|
 Jonathan Villar
 |
2B |
$554,500 |
0.88% |
0.79 |
1.42 |
$706,184 |
|
 Jimmy Nelson
 |
SP |
$547,000 |
0.87% |
4.12 |
7.53 |
$132,717 |
|
 Junior Guerra
 |
SP |
$546,200 |
0.87% |
-0.81 |
— |
— |
|
 Zach Davies
 |
SP |
$546,200 |
0.87% |
2.64 |
4.84 |
$206,544 |
|
 Hernán Pérez
 |
LF |
$545,700 |
0.87% |
1.32 |
2.41 |
$414,685 |
|
 Travis Shaw
 |
3B |
$544,400 |
0.86% |
4.20 |
7.72 |
$129,593 |
|
 Domingo Santana
 |
RF |
$542,200 |
0.86% |
3.20 |
5.91 |
$169,263 |
|
 Keon Broxton
 |
CF |
$541,200 |
0.86% |
0.87 |
1.62 |
$618,923 |
|
 Jhan Mariñez
 |
RP |
$540,200 |
0.86% |
-0.46 |
— |
— |
|
 Jett Bandy
 |
C |
$539,800 |
0.86% |
-0.34 |
— |
— |
|
 Corey Knebel
 |
RP |
$538,900 |
0.85% |
1.77 |
3.28 |
$304,947 |
|
 Manny Piña
 |
C |
$538,200 |
0.85% |
1.79 |
3.32 |
$301,148 |
|
 Orlando Arcia
 |
SS |
$538,100 |
0.85% |
3.31 |
6.15 |
$162,637 |
|
 Jacob Barnes
 |
RP |
$537,700 |
0.85% |
1.31 |
2.44 |
$409,445 |
|
 Taylor Jungmann
 |
RP |
$537,600 |
0.85% |
-0.05 |
— |
— |
|
 Andrew Susac
 |
PH |
$537,400 |
0.85% |
-0.22 |
— |
— |
|
 Jesús Aguilar
 |
1B |
$536,000 |
0.85% |
1.36 |
2.54 |
$393,288 |
|
| Player | Pos | Salary | Pct | WARP | WARP/$M | $/WARP | Current Status |
|---|
 Kirk Nieuwenhuis
 |
LF |
$20,000,000 |
31.72% |
-0.57 | 0.08 | $12,566,445 |
|
| Year | Brewers payroll | Avg payroll | Diff |
|---|
| 2000 | $35,770,333 | $57,491,092 | $-21,720,759 |
| 2001 | $44,278,333 | $67,120,750 | $-22,842,417 |
| 2002 | $50,062,333 | $69,204,705 | $-19,142,372 |
| 2003 | $41,052,000 | $72,156,639 | $-31,104,639 |
| 2004 | $27,428,500 | $71,426,357 | $-43,997,857 |
| 2005 | $38,488,000 | $73,628,169 | $-35,140,169 |
| 2006 | $60,452,000 | $81,192,832 | $-20,740,832 |
| 2007 | $70,575,500 | $85,747,487 | $-15,171,987 |
| 2008 | $78,594,000 | $93,079,041 | $-14,485,041 |
| 2009 | $80,682,500 | $92,957,049 | $-12,274,549 |
| 2010 | $82,258,000 | $94,957,956 | $-12,699,956 |
| 2011 | $84,253,333 | $97,426,414 | $-13,173,081 |
| 2012 | $97,650,833 | $100,689,500 | $-3,038,667 |
| 2013 | $89,978,333 | $106,658,387 | $-16,680,054 |
| 2014 | $103,697,967 | $115,428,670 | $-11,730,703 |
| 2015 | $104,237,000 | $125,458,486 | $-21,221,486 |
| 2016 | $63,908,300 | $130,290,910 | $-66,382,610 |
| 2017 | $63,061,300 | $136,573,000 | $-73,511,700 |
| 2018 | $90,964,571 | $135,681,867 | $-44,717,296 |
| 2019 | $123,430,400 | $134,776,225 | $-11,345,825 |
| 2020 | $98,563,503 | $138,321,485 | $-39,757,982 |
| 2021 | $96,341,127 | $129,635,938 | $-33,294,811 |
| 2022 | $130,946,826 | $147,002,411 | $-16,055,585 |
| 2023 | $117,578,060 | $158,155,877 | $-40,577,817 |
| 2024 | $78,234,960 | $133,074,721 | $-54,839,761 |
| 2025 | $59,700,000 | $94,180,059 | $-34,480,059 |
| 2026 | $45,700,000 | $74,818,461 | $-29,118,461 |
| 2027 | $33,700,000 | $56,972,319 | $-23,272,319 |
| 2028 | $27,000,000 | $45,437,759 | $-18,437,759 |
| 2029 | $6,500,000 | $37,269,628 | $-30,769,628 |
| Year | Brewers payroll | Avg payroll | Diff |
|---|
| 2000 | $103,697,967 | $100,689,500 | $-21,720,759 | |
 2017 Milwaukee Brewers


