This week’s question comes from T.W., who asks:
Does anyone track errors against for a hitter? It would seem to me that this
might be a consistent skill (due to speed, an ability to consistently hit
hard ground balls, and continued hustle). If it is a consistent skill
shouldn’t this be tracked and shouldn’t certain players get recognition for
this? I would think that historically Pete Rose would have
"caused" more errors than someone like Ken Griffey Jr. due
simply to hitting style and hustle. So, my question is, can this be
measured? If so, who are the great players historically and today? If so,
shouldn’t this be accounted for in a players OBP?
Thanks, T.W. This is one of the most common questions I’ve gotten over the
years between BP.com and my own Stathead.com
Web sites. Fortunately, with the availability of play-by-play data over the past
couple of decades, it’s possible to investigate this properly.
I have play-by-play data for 1978-2000, so all of the analysis in this
article will cover just those years. My first step was to look at the yearly
totals, to see what the highest seasonal totals for reached-on-error (ROE)
have been. Only four players have reached base via error 20 or more times in
a single season, but some of them probably aren’t who you’d expect:
Year Player            ROE
1979 Jack Clark        21
1986 Willie McGee      21
1998 Derek Jeter       20
1986 Carney Lansford   20
1984 Steve Sax         17
1982 Rafael Ramirez    17
1979 Al Cowens         17
1991 Cal Ripken Jr.    17
1985 Tommy Herr        16
1982 Pedro Guerrero    16
1993 Darren Lewis      16
1989 Roberto Alomar    16
1998 Vinny Castilla    16
1978 Larry Bowa        16
1984 Ryne Sandberg     16
1996 Marquis Grissom   16
1983 Ryne Sandberg     15
1983 Tim Wallach       15
1984 Julio Franco      15
1984 Brett Butler      15
1982 Paul Molitor      15
1990 Joe Carter        15
1990 Shawon Dunston    15
Willie McGee you might have guessed, as he fits the speedy profile
you naturally suspect of having an ROE ability. But Jack Clark? Not
only is he not thought of as particularly swift afoot (though he did have 11
steals in 1979), but he’s also one of the Three True Outcome demigods, with
over 37% of his career PA ending without him putting the ball in play. And
while there’s more speedsters on the list, there are some surprising names
like Clark, Tim Wallach, and Vinny Castilla, too.
Of course, we’re looking at raw totals, and not rates. Getting a lot of
plate appearances will help you rack up the ROE totals, regardless of
ability. So next we’ll look at the highest ROE% (percentage of plate
appearances ending with the batter reaching base on error):
Limiting the set of players to those with 500 or more plate appearances, the
list of seasons with a ROE% or 2.5% or greater is:
Player           ROE    PA   ROE%
Willie McGee      21   539  3.90%
Jack Clark        21   598  3.51%
Carney Lansford   20   640  3.13%
Al Cowens         17   568  2.99%
Derek Jeter       20   694  2.88%
Darren Lewis      16   572  2.80%
Steve Sax         17   622  2.73%
Shawon Dunston    15   573  2.62%
Rafael Ramirez    17   669  2.54%
All of the players on this list are also represented on the previous list.
Only 86 out of the 1704 player-seasons represented topped 2% ROE, so we are
talking about a fairly small impact on OBP if we were to include it,
probably comparable to or slightly less significant than hit-by-pitches.
The next step is to ask whether the tendency to reach base on error persists
from year to year (thus indicating some level of ability innate to the
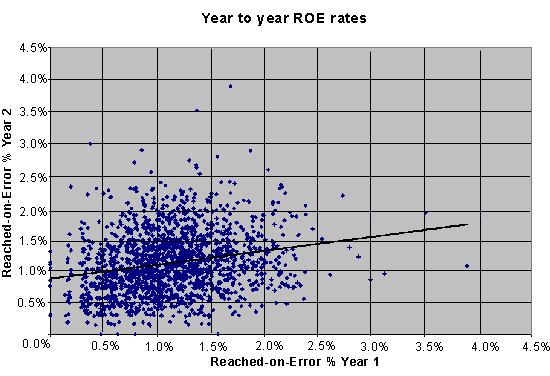
player). I’ve plotted ROE rates in consecutive seasons for players with 500+
plate appearances in both seasons in the chart below:

The correlation between year 1 ROE% and year 2 ROE% is 0.2183, which means
there’s a slight relationship there, but not terribly strong (less than 5%
of the year-to-year variance can be explained by differences in ability
among players). Of course, we’re talking about an event with pretty low
frequency anyway, so it’s easy for a true effect to get lost in the small
sample sizes of a single season.
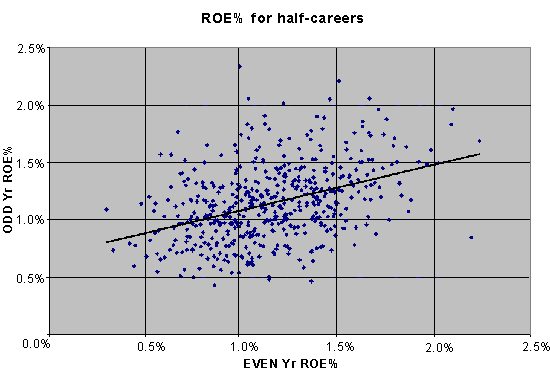
What if we borrow
a technique I used in analyzing Voros McCracken’s DIPS
research, and split each player’s career into even- and odd-numbered halves
(1000+ PA in each half) and see if the evidence for ROE ability is any
stronger?

It may not be clear at first glance, but there is actually a significantly
more distinct linear trend in the chart above versus the year-to-year chart
presented earlier. The correlation between the ROE% in the even-year
half-career and the odd-year half-career jumps to 0.4114, with more than 16%
of the variance now attributable to ability.
So there’s decent evidence that reaching base via error is at least
partially due to the ability of the batter, ranging from about 0.75% to
1.75% or so for most players. It’s difficult to spot using just a single
year’s worth of data, but using career ROE% to date is not a bad way to set
an expectation for the future.
As for its effect on OBP, there’s a reasonable argument to be made to
include it, as it does partially reflect the skill of the batter to avoid an
out by inducing an error. However, since all players would get somewhat of a
boost from including it, the importance of the effect is how much we might
overrate or underrate a player’s OBP relative to his peers by not including
ROE%.
As it turns out, the effect is rather small. The standard deviation in
career ROE% for our half-career subset (about 500 players) is 2.7 points of
OBP, meaning that more than 90% of players would be within five points of
the OBP they would have as currently measured plus the league-average boost
in ROE%. So while it makes some logical sense to include ROE% in OBP, we’re
probably not missing a huge piece of the sabermetric puzzle by not having it
in the standard calculation.
However, we can’t let a topic like this go by without at least sharing the
career leaders. So we’ll close with a couple of tables, one of the players
with the highest career ROE%, and the other of the lowest career ROE%.
Highest career ROE% (min: 2000 PA), 1978-2000
Player           ROE    PA   ROE%
Bob Horner        86  4213 2.041%
Rudy Law          53  2647 2.002%
Johnny Bench      47  2365 1.987%
Wil Cordero       71  3635 1.953%
Billy Sample      52  2798 1.858%
Garry Maddox      63  3431 1.836%
Glenn Hubbard     94  5122 1.835%
John Castino      47  2578 1.823%
Rey Sanchez       64  3557 1.799%
Derek Jeter       64  3565 1.795%
Ricky Jordan      39  2221 1.756%
Rafael Ramirez   103  5887 1.750%
Willie McGee     143  8188 1.746%
Milt May          37  2124 1.742%
Otis Nixon       101  5800 1.741%
Bob Dernier       48  2757 1.741%
Mark Carreon      38  2190 1.735%
Johnnie LeMaster  55  3179 1.730%
Al Wiggins        44  2553 1.723%
Jose Vizcaino     73  4244 1.720%
Luis Salazar      75  4375 1.714%
Ron Jackson       42  2466 1.703%
Lowest career ROE% (min: 2000 PA), 1978-2000
Player           ROE    PA   ROE%
John Mayberry      9  2351 0.383%
Mo Vaughn         26  5756 0.452%
Willie Greene     10  2183 0.458%
Ken Phelps        11  2287 0.481%
Paul Sorrento     20  3890 0.514%
Chad Kreuter      14  2569 0.545%
Darren Daulton    24  4340 0.553%
Jeromy Burnitz    19  3254 0.584%
Luis Alicea       23  3923 0.586%
Darrin Fletcher   22  3683 0.597%
Rico Brogna       18  3000 0.600%
Geno Petralli     13  2131 0.610%
Carlos Delgado    21  3430 0.612%
Rafael Palmeiro   55  8942 0.615%
Pat Kelly         14  2237 0.626%
Ray Lankford      36  5741 0.627%
Rusty Staub       14  2213 0.633%
Jim Dwyer         17  2673 0.636%
Darin Erstad      18  2811 0.640%
Carl Yastrzemski  19  2963 0.641%
Ernie Whitt       27  4206 0.642%
Matt Stairs       16  2487 0.643%
Keith Woolner is an author of Baseball Prospectus. You can contact him by
clicking here.
Thank you for reading
This is a free article. If you enjoyed it, consider subscribing to Baseball Prospectus. Subscriptions support ongoing public baseball research and analysis in an increasingly proprietary environment.
Subscribe now