This article was originally published on Oct. 1.
What if Shane Bieber had decided to take a different path in life? What if he had called up his cousin Justin (I know, not actually related) and said “Hey, can I go out on tour with you?” and become a roadie for 2017’s most relevant cultural icon. Bieber just completed the American League (as much as that means in this weird season) pitching “triple crown,” notching the most pitching wins, lowest ERA, and most strikeouts of any pitcher in the AL. What would Cleveland have done without him?
Someone out there is scratching their head wondering “Did he forget about WAR(P)?” Yes. I know about WAR(P). The question that I asked is the conceptual basis of WAR(P). But does WAR (can I just call it that?) adequately model the question that it’s asking? The way WAR has traditionally evaluated pitchers (and position players for that matter) is to compare what a player actually did to the performance a team “would have gotten” over the same amount of playing time, based on a mathematically constructed baseline for “would have gotten.” If Shane Bieber threw 200 innings, we would multiply “replacement level” performance times 200 innings or 800 batters faced.
It’s not a terrible model. It might even be mostly right. It’s certainly better than what came before, but is there a hole in the model that needs fixing? We assume Bieber’s starts would have been covered by some fringy Triple-A call-up or long-reliever-turned-starter or waiver wire wunderkind. But, there’s an assumption that’s baked in there that doesn’t really hold. Our faux-Bieber might make the same number of starts as Justin… erm, Shane, or might even face the same number of batters, but faux-Bieber isn’t likely to be as good as the real Bieber (who is?), and so probably wouldn’t record the same number of outs. One of the ways that pitcher shows quality is by recording outs, and that’s … part of the way that you win the game. It means that even after the same number of batters, the replacement starter has left the bullpen with more to do.
There’s also a sample selectivity problem. Bieber gets to pitch the sixth inning. Our replacement starter? Maybe not. In fact, Bieber gets to pitch deeper into games as a result of being good; managers take SP6s out of the game before they get especially rancid.
What I want to do is to a gut-check on WAR for starters, in two parts. Today, I want to quantify value not in terms of how a pitcher performs on the stat line, but how much a pitcher contributes to winning a game. Next time, we’ll talk about how what a replacement starter doesn’t do affects the team’s chances of winning.
Warning! Gory Mathematical Details Ahead!
I used data from 2015-2019 to identify the 150 pitchers who recorded the most outs as a starter. I then sorted them by xFIP (because it was easy, given the way my data were set up) into tiers of 30. Your top 30 are your SP1s, numbers 31-60 are the SP2s, and so on. Everyone else who was not in the top 150 was a “replacement starter.”
This one is trickier than you might think. Sabermetrics is 95 percent accounting for the bias in your sample and five percent long division. I tried a few wrinkles on all this. I also used number of starts, rather than outs. I tried sorting within teams to get the tiers. I tried using outs recorded as the basis for sorting rather than xFIP. The results came out basically the same.
The primary thing that I was interested in was win probability for the pitching team when the starting pitcher exited the game. For those wondering why I’m binning groups of pitchers, it’s because win probability is dependent a great deal on what the team’s offense does, so using an individual pitcher would conflate that pitcher with the team’s offense. When you look at larger groups of pitchers, you can see broader patterns.
Before I got into the bins of pitchers, I looked at another graph, which looked at the average win probability for the pitching team when the starter exited as a function of how many outs the starter recorded. (As a check, I also looked at how often the team actually won, and the lines coincided nicely.)
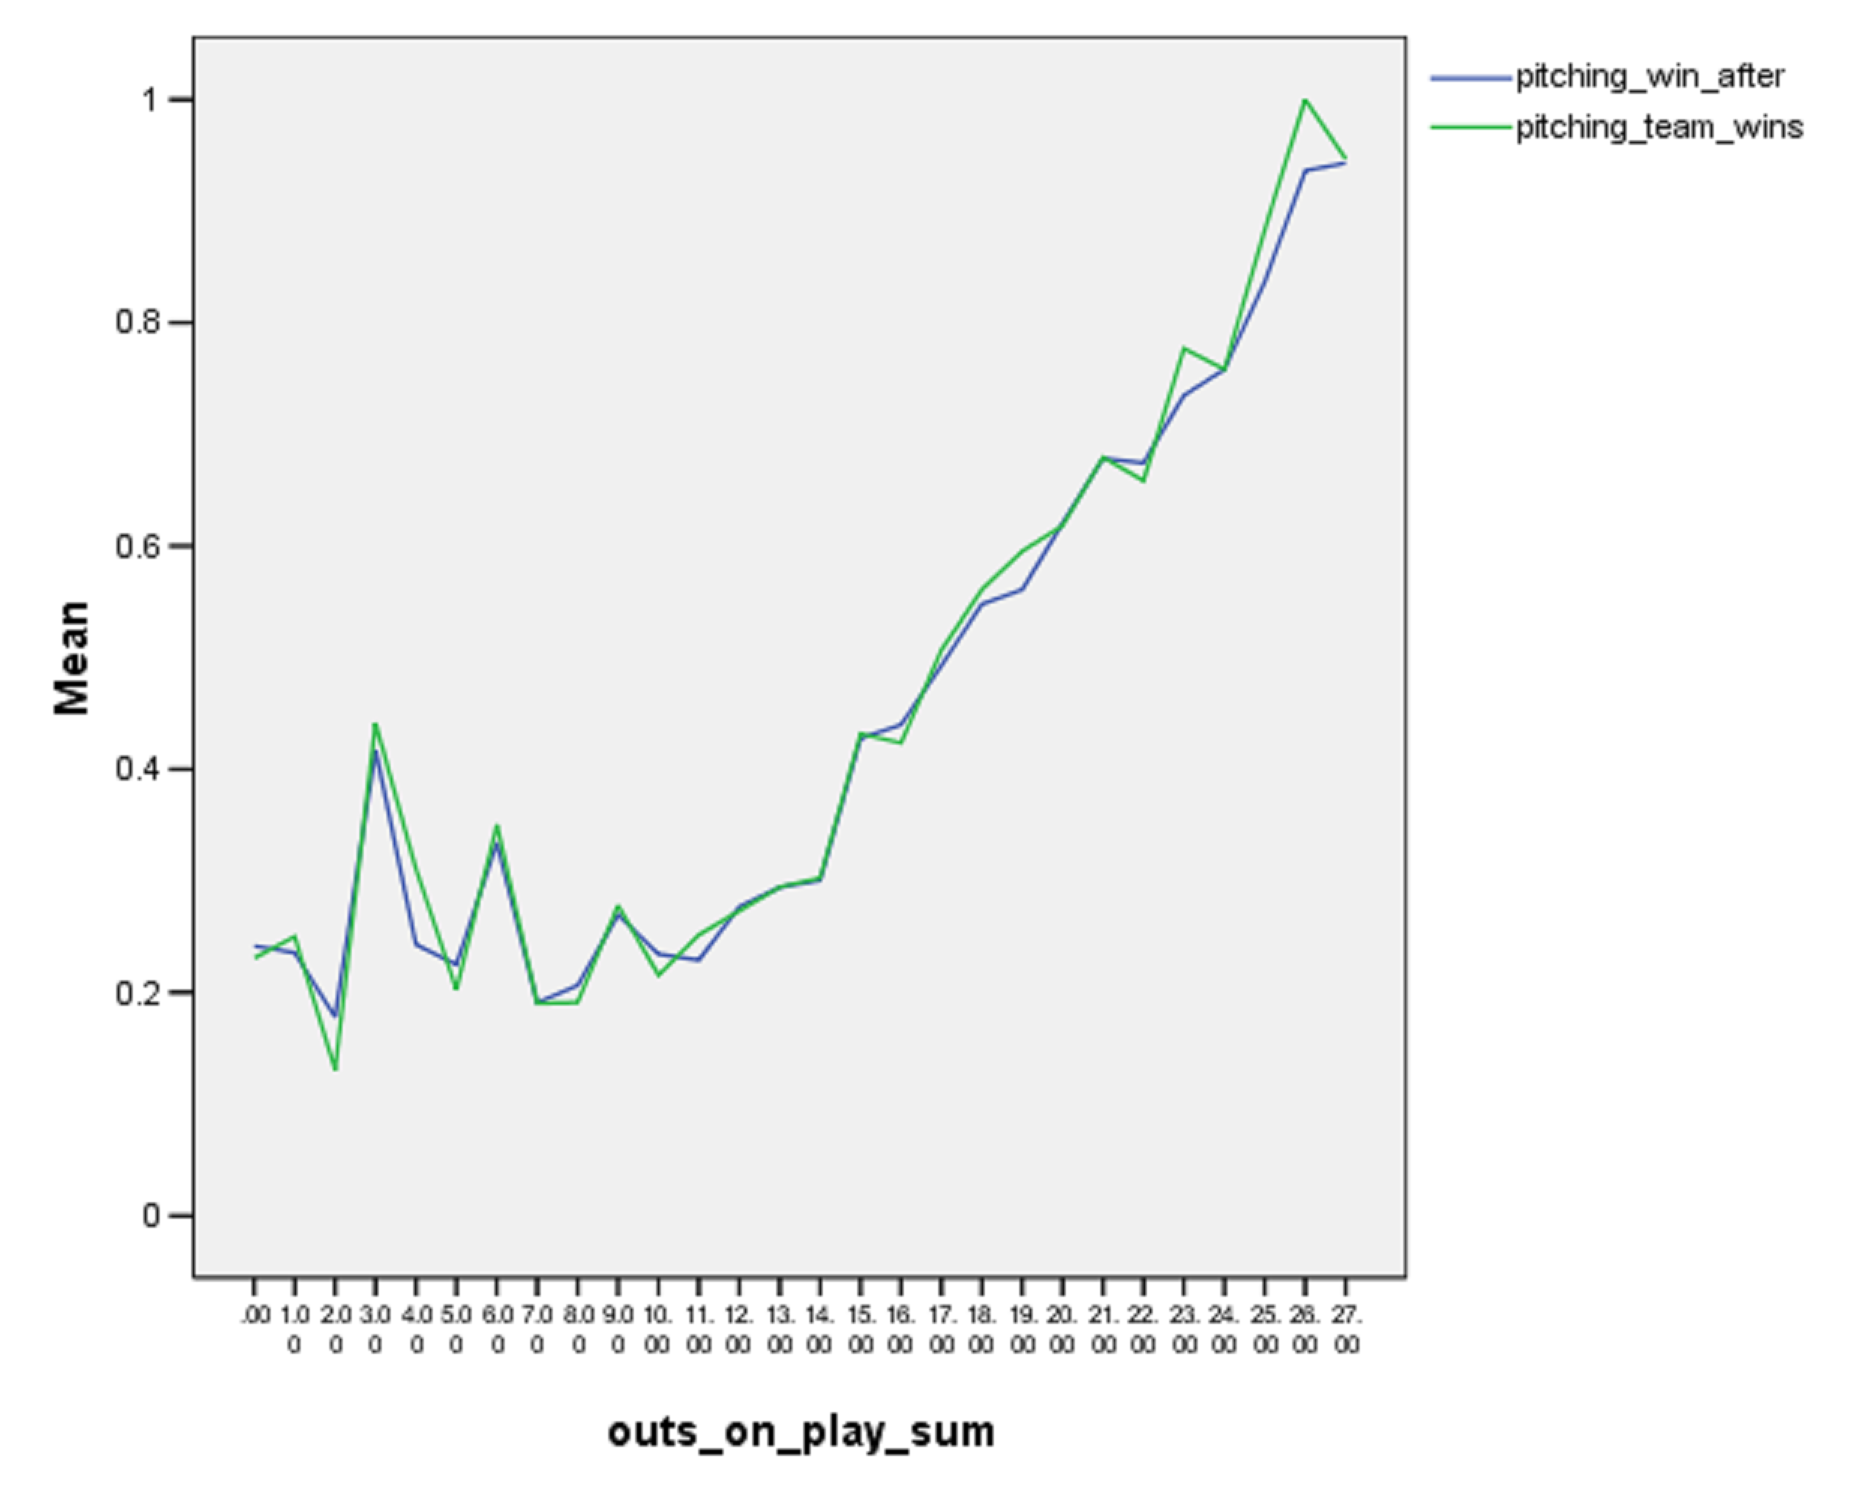
We can see that a starter doesn’t really begin building win probability for the team until you get to out number 15 (five innings). Before that, win probability hovers around 25 percent. If you can’t even give your team a five-and-dive, they might still win, but probably only because sometime the other starter is a dud too.
| Tier (by xFIP) | Average Outs Recorded by Starter | Percentage of Games with at least 15 outs recorded | Average win probability at starter exit | Average number of opponent runs given up at exit |
| Top 30 | 18.33 | 88% | 59% | 2.25 |
| 31-60 | 17.42 | 84% | 52% | 2.58 |
| 61-90 | 16.95 | 82% | 50% | 2.66 |
| 91-120 | 16.69 | 79% | 48% | 2.77 |
| 121-150 | 16.33 | 76% | 46% | 2.95 |
| Replacements | 13.83 | 56% | 43% | 2.79 |
(Note: because the concept of “The Opener” has emerged in the past few years, the “replacement” starts might include a few one-inning starts that were purposeful. I re-ran the same analyses with a 2010-2014 data set—before the Opener was broadly discussed—and again, got much the same answer).
An ace pitcher leaves the game with a win probability that is, on average, 16 percentage points higher than a replacement pitcher. Also (and not coincidentally), 4.5 more outs. Over 30 starts, that alone is 4.8 wins better than a replacement starter. But those 4.5 outs are key. Again, pitchers are not randomly removed from games. Managers select the time when, in their judgment, the pitcher has had enough and is no longer an asset to the team’s chances. If we were to force the replacement starter to get to the same number of outs on a regular basis as the ace starter, it seems likely that the results would get progressively worse. It’s impossible to know how bad, specifically because the pitcher gets taken out, but our replacement starter on average has already given up half a run more in an inning and a half less of work. And now, they’re tired and are on their third trip through the order. This probably isn’t going to end well.
Also worth pointing out: The gap between a top-tier starter and a replacement starter is 16 points of win probability per start. The gap between the top tier and the second tier is 7 points. Truly excellent starters are probably further ahead of “the field” than we give them credit for.
That 4.8 wins number sounds about right for someone in that top 30 tier of starters as a WAR value. From that perspective, WAR seems to check out. But we’re not factoring in two big negative space issues. WAR compares a regular starter to what replacement starters as a whole actually did. We don’t have a way to account for what they would have done if they had to carry the same load as a regular starter. We also don’t account for the secondary effects of the added bullpen workload, both in-game and over the course of a season. What is the effect of an inning that the bullpen never has to pitch?
I have to assume that both of those effects would add value to what an ace pitcher does, and as a result, would push their value up even higher. Next time, we’ll talk about how large of an effect that is and whether ace pitchers (and good starters in general) are worth much more than we even give them credit for.
Thank you for reading
This is a free article. If you enjoyed it, consider subscribing to Baseball Prospectus. Subscriptions support ongoing public baseball research and analysis in an increasingly proprietary environment.
Subscribe now