| Player | Pos | Salary | Pct | WARP | WARP/$M | $/WARP | Current Status |
|---|
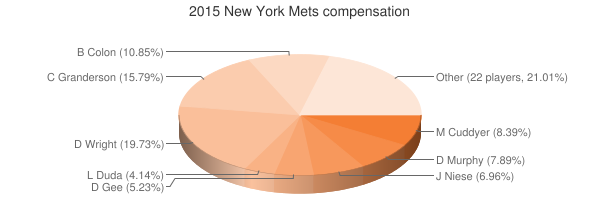
 David Wright
 |
3B |
$20,000,000 |
19.73% |
1.49 |
0.07 |
$13,457,863 |
|
 Curtis Granderson
 |
RF |
$16,000,000 |
15.79% |
5.84 |
0.36 |
$2,740,646 |
|
 Bartolo Colon
 |
RP |
$11,000,000 |
10.85% |
2.61 |
0.24 |
$4,222,487 |
|
 Michael Cuddyer
 |
LF |
$8,500,000 |
8.39% |
1.27 |
0.15 |
$6,675,882 |
|
 Daniel Murphy
 |
2B |
$8,000,000 |
7.89% |
2.32 |
0.29 |
$3,451,921 |
|
 Jonathon Niese
 |
RP |
$7,050,000 |
6.96% |
2.31 |
0.33 |
$3,049,374 |
|
 Dillon Gee
 |
RP |
$5,300,000 |
5.23% |
0.73 |
0.14 |
$7,277,471 |
|
 Lucas Duda
 |
1B |
$4,200,000 |
4.14% |
3.67 |
0.87 |
$1,143,953 |
|
 Bobby Parnell
 |
RP |
$3,700,000 |
3.65% |
-0.09 |
— |
— |
|
 Jenrry Mejia
 |
RP |
$2,595,000 |
2.56% |
0.19 |
0.07 |
$13,854,113 |
|
 Jerry Blevins
 |
RP |
$2,400,000 |
2.37% |
0.12 |
0.05 |
$19,498,245 |
|
 Rubén Tejada
 |
SS |
$1,880,000 |
1.86% |
2.11 |
1.12 |
$890,898 |
|
 John Mayberry Jr.
 |
PH |
$1,450,000 |
1.43% |
-0.22 |
— |
— |
|
 Buddy Carlyle
 |
RP |
$725,000 |
0.72% |
0.09 |
0.12 |
$8,290,689 |
|
 Matt Harvey
 |
RP |
$614,125 |
0.61% |
5.07 |
8.25 |
$121,203 |
|
 Carlos Torres
 |
RP |
$582,125 |
0.57% |
1.69 |
2.91 |
$344,062 |
|
 Jacob deGrom
 |
RP |
$556,875 |
0.55% |
6.92 |
12.42 |
$80,509 |
|
 Juan Lagares
 |
CF |
$553,696 |
0.55% |
0.84 |
1.51 |
$661,589 |
|
 Zack Wheeler
 |
DNP |
$546,250 |
0.54% |
— |
— |
— |
|
 Travis d'Arnaud
 |
C |
$525,424 |
0.52% |
4.20 |
7.98 |
$125,248 |
|
 Kirk Nieuwenhuis
 |
PH |
$525,415 |
0.52% |
0.62 |
1.19 |
$841,687 |
|
 Jeurys Familia
 |
RP |
$523,925 |
0.52% |
2.02 |
3.85 |
$259,670 |
|
 Alex Torres
 |
RP |
$522,900 |
0.52% |
-0.10 |
— |
— |
|
 Josh Edgin
 |
DNP |
$520,625 |
0.51% |
— |
— |
— |
|
 Anthony Recker
 |
C |
$517,880 |
0.51% |
-0.63 |
— |
— |
|
 Vic Black
 |
DNP |
$515,500 |
0.51% |
— |
— |
— |
|
 Wilmer Flores
 |
SS |
$513,543 |
0.51% |
2.39 |
4.65 |
$214,891 |
|
 Rafael Montero
 |
RP |
$511,000 |
0.50% |
0.16 |
0.32 |
$3,134,489 |
|
 César Puello
 |
DNP |
$507,500 |
0.50% |
— |
— |
— |
|
 Sean Gilmartin
 |
RP |
$507,500 |
0.50% |
1.41 |
2.77 |
$360,420 |
|
| Player | Pos | Salary | Pct | WARP | WARP/$M | $/WARP | Current Status |
|---|
|
Curtis Granderson |
DNP |
$20,000,000 |
19.73% |
-0.09 | 12.42 | $13,457,863 |
|
| Year | Mets payroll | Avg payroll | Diff |
|---|
| 1992 | $2,950,000 | $2,356,071 | $593,929 |
| 1993 | $3,000,000 | $3,410,000 | $-410,000 |
| 1994 | $3,883,333 | $3,911,904 | $-28,571 |
| 1995 | $4,883,333 | $5,208,333 | $-325,000 |
| 1996 | $5,133,333 | $4,583,416 | $549,917 |
| 1999 | $8,871,429 | $7,867,823 | $1,003,606 |
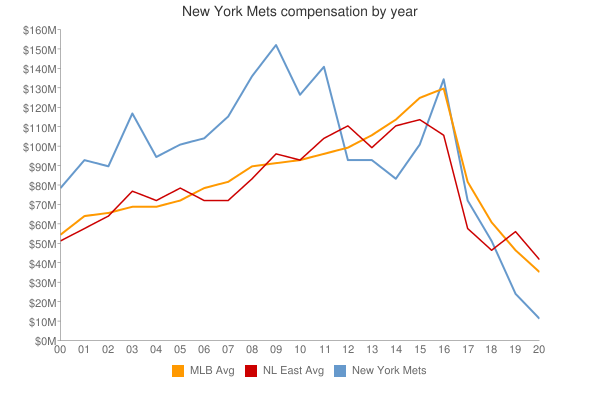
| 2000 | $79,449,762 | $57,491,092 | $21,958,670 |
| 2001 | $93,043,928 | $67,120,750 | $25,923,178 |
| 2002 | $91,995,260 | $69,204,705 | $22,790,555 |
| 2003 | $117,324,763 | $72,156,639 | $45,168,124 |
| 2004 | $95,283,804 | $71,426,357 | $23,857,447 |
| 2005 | $100,563,370 | $73,628,169 | $26,935,201 |
| 2006 | $102,337,140 | $81,192,832 | $21,144,308 |
| 2007 | $116,683,000 | $85,747,487 | $30,935,513 |
| 2008 | $137,759,000 | $93,079,041 | $44,679,959 |
| 2009 | $153,550,596 | $92,957,049 | $60,593,547 |
| 2010 | $127,098,096 | $94,957,956 | $32,140,140 |
| 2011 | $142,797,167 | $97,426,414 | $45,370,753 |
| 2012 | $94,508,922 | $100,689,500 | $-6,180,578 |
| 2013 | $93,684,590 | $106,658,387 | $-12,973,797 |
| 2014 | $84,951,365 | $115,428,670 | $-30,477,305 |
| 2015 | $101,344,283 | $125,458,486 | $-24,114,203 |
| 2016 | $135,188,085 | $130,290,910 | $4,897,175 |
| 2017 | $154,437,460 | $136,573,000 | $17,864,460 |
| 2018 | $150,558,844 | $135,681,867 | $14,876,977 |
| 2019 | $157,052,231 | $134,776,225 | $22,276,006 |
| 2020 | $170,725,429 | $138,321,485 | $32,403,944 |
| 2021 | $215,623,963 | $129,635,938 | $85,988,025 |
| 2022 | $278,683,333 | $147,002,411 | $131,680,922 |
| 2023 | $359,669,166 | $158,155,877 | $201,513,289 |
| 2024 | $286,854,409 | $133,074,721 | $153,779,688 |
| 2025 | $138,459,294 | $94,180,059 | $44,279,235 |
| 2026 | $101,577,765 | $74,818,461 | $26,759,304 |
| 2027 | $87,827,765 | $56,972,319 | $30,855,446 |
| 2028 | $54,600,000 | $45,437,759 | $9,162,241 |
| 2029 | $54,600,000 | $37,269,628 | $17,330,372 |
| 2030 | $54,600,000 | $39,665,769 | $14,934,231 |
| 2031 | $34,100,000 | $38,360,152 | $-4,260,152 |
| Year | Mets payroll | Avg payroll | Diff |
|---|
| 1992 | $117,324,763 | $100,689,500 | $-12,973,797 | |
 2015 New York Mets