| Player | Pos | Salary | Pct | WARP | WARP/$M | $/WARP | Current Status |
|---|
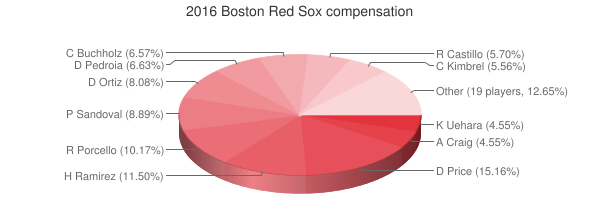
 David Price
 |
SP |
$30,000,000 |
15.16% |
5.74 |
0.19 |
$5,224,451 |
|
 Hanley Ramirez
 |
1B |
$22,750,000 |
11.50% |
0.46 |
0.02 |
$48,988,680 |
|
 Rick Porcello
 |
SP |
$20,125,000 |
10.17% |
4.89 |
0.24 |
$4,111,867 |
|
 Pablo Sandoval
 |
3B |
$17,600,000 |
8.89% |
-0.09 |
— |
— |
|
 David Ortiz
 |
DH |
$16,000,000 |
8.08% |
3.63 |
0.23 |
$4,406,354 |
|
 Dustin Pedroia
 |
2B |
$13,125,000 |
6.63% |
2.25 |
0.17 |
$5,823,627 |
|
 Clay Buchholz
 |
SP |
$13,000,000 |
6.57% |
-0.27 |
— |
— |
|
 Rusney Castillo
 |
LF |
$11,271,429 |
5.70% |
-0.03 |
— |
— |
|
 Craig Kimbrel
 |
RP |
$11,000,000 |
5.56% |
1.27 |
0.12 |
$8,665,238 |
|
 Allen Craig
 |
DNP |
$9,000,000 |
4.55% |
— |
— |
— |
|
 Koji Uehara
 |
RP |
$9,000,000 |
4.55% |
0.56 |
0.06 |
$16,115,833 |
|
 Chris Young
 |
LF |
$6,500,000 |
3.28% |
0.82 |
0.13 |
$7,907,254 |
|
 Ryan Hanigan
 |
C |
$3,700,000 |
1.87% |
-1.24 |
— |
— |
|
 Junichi Tazawa
 |
RP |
$3,375,000 |
1.71% |
0.79 |
0.23 |
$4,272,530 |
|
 Joe Kelly
 |
SP |
$2,600,000 |
1.31% |
0.04 |
0.02 |
$61,381,702 |
|
 Robbie Ross Jr.
 |
RP |
$1,250,000 |
0.63% |
0.62 |
0.50 |
$2,009,252 |
|
 Xander Bogaerts
 |
SS |
$650,000 |
0.33% |
2.55 |
3.92 |
$255,009 |
|
 Brock Holt
 |
LF |
$606,000 |
0.31% |
1.21 |
1.99 |
$501,739 |
|
 Mookie Betts
 |
RF |
$566,000 |
0.29% |
7.33 |
12.95 |
$77,237 |
|
 Tommy Layne
 |
RP |
$563,750 |
0.28% |
-0.39 |
— |
— |
|
 Jackie Bradley Jr.
 |
CF |
$546,500 |
0.28% |
4.01 |
7.34 |
$136,265 |
|
 Brandon Workman
 |
DNP |
$539,500 |
0.27% |
— |
— |
— |
|
 Carson Smith
 |
RP |
$529,000 |
0.27% |
-0.05 |
— |
— |
|
 Eduardo Rodriguez
 |
SP |
$521,000 |
0.26% |
-0.49 |
— |
— |
|
 Blake Swihart
 |
LF |
$518,500 |
0.26% |
0.03 |
0.06 |
$16,746,821 |
|
 Travis Shaw
 |
3B |
$515,000 |
0.26% |
1.55 |
3.01 |
$332,586 |
|
 Steven Wright
 |
SP |
$514,500 |
0.26% |
4.27 |
8.29 |
$120,606 |
|
 Christian Vázquez
 |
C |
$513,000 |
0.26% |
0.37 |
0.72 |
$1,381,111 |
|
 Matt Barnes
 |
RP |
$511,000 |
0.26% |
0.22 |
0.43 |
$2,314,930 |
|
 Noé Ramirez
 |
RP |
$509,500 |
0.26% |
-0.11 |
— |
— |
|
| Player | Pos | Salary | Pct | WARP | WARP/$M | $/WARP | Current Status |
|---|
|
Jackie Bradley Jr. |
DNP |
$30,000,000 |
15.16% |
-0.09 | 12.95 | $48,988,680 |
|
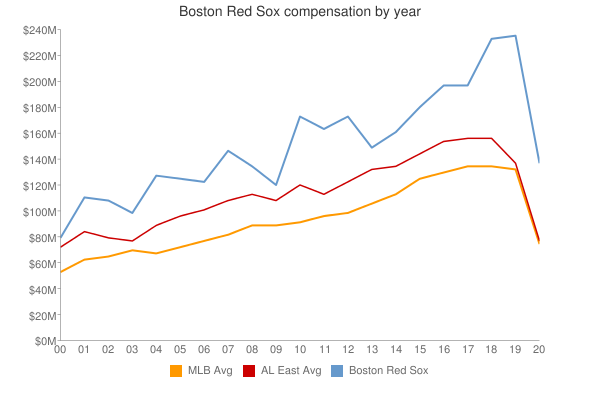
| Year | Red Sox payroll | Avg payroll | Diff |
|---|
| 1997 | $1,100,000 | $4,892,222 | $-3,792,222 |
| 1998 | $9,100,000 | $6,661,904 | $2,438,096 |
| 1999 | $14,500,000 | $7,867,823 | $6,632,177 |
| 2000 | $80,978,533 | $57,491,092 | $23,487,441 |
| 2001 | $111,488,333 | $67,120,750 | $44,367,583 |
| 2002 | $108,645,000 | $69,204,705 | $39,440,295 |
| 2003 | $99,251,500 | $72,156,639 | $27,094,861 |
| 2004 | $128,545,500 | $71,426,357 | $57,119,143 |
| 2005 | $125,097,825 | $73,628,169 | $51,469,656 |
| 2006 | $124,406,500 | $81,192,832 | $43,213,668 |
| 2007 | $147,568,833 | $85,747,487 | $61,821,346 |
| 2008 | $136,798,083 | $93,079,041 | $43,719,042 |
| 2009 | $122,803,640 | $92,957,049 | $29,846,591 |
| 2010 | $173,759,833 | $94,957,956 | $78,801,877 |
| 2011 | $165,828,976 | $97,426,414 | $68,402,562 |
| 2012 | $175,205,284 | $100,689,500 | $74,515,784 |
| 2013 | $150,655,000 | $106,658,387 | $43,996,613 |
| 2014 | $163,414,996 | $115,428,670 | $47,986,326 |
| 2015 | $180,779,329 | $125,458,486 | $55,320,843 |
| 2016 | $197,899,679 | $130,290,910 | $67,608,769 |
| 2017 | $197,041,179 | $136,573,000 | $60,468,179 |
| 2018 | $233,200,428 | $135,681,867 | $97,518,561 |
| 2019 | $236,171,428 | $134,776,225 | $101,395,203 |
| 2020 | $187,907,969 | $138,321,485 | $49,586,484 |
| 2021 | $176,099,500 | $129,635,938 | $46,463,562 |
| 2022 | $212,015,000 | $147,002,411 | $65,012,589 |
| 2023 | $154,435,000 | $158,155,877 | $-3,720,877 |
| 2024 | $97,266,667 | $133,074,721 | $-35,808,054 |
| 2025 | $86,566,667 | $94,180,059 | $-7,613,392 |
| 2026 | $73,916,667 | $74,818,461 | $-901,794 |
| 2027 | $71,416,667 | $56,972,319 | $14,444,348 |
| 2028 | $59,916,667 | $45,437,759 | $14,478,908 |
| 2029 | $59,916,667 | $37,269,628 | $22,647,039 |
| 2030 | $44,750,000 | $39,665,769 | $5,084,231 |
| 2031 | $44,000,000 | $38,360,152 | $5,639,848 |
| 2032 | $35,000,000 | $47,925,459 | $-12,925,459 |
| 2033 | $31,000,000 | $43,068,924 | $-12,068,924 |
| Year | Red Sox payroll | Avg payroll | Diff |
|---|
| 1997 | $111,488,333 | $100,689,500 | $101,395,203 | |
 2016 Boston Red Sox