| Player | Pos | Salary | Pct | WARP | WARP/$M | $/WARP | Current Status |
|---|
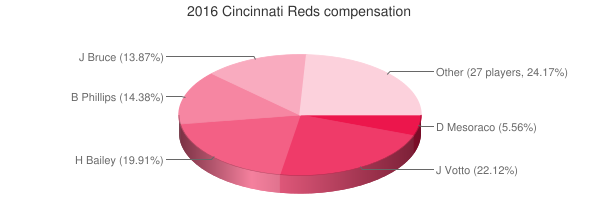
 Joey Votto
 |
1B |
$20,000,000 |
22.12% |
6.27 |
0.31 |
$3,189,192 |
|
 Homer Bailey
 |
SP |
$18,000,000 |
19.91% |
0.33 |
0.02 |
$54,530,252 |
|
 Brandon Phillips
 |
2B |
$13,000,000 |
14.38% |
1.58 |
0.12 |
$8,241,671 |
|
 Jay Bruce
 |
RF |
$12,541,667 |
13.87% |
2.31 |
0.18 |
$5,420,166 |
|
 Devin Mesoraco
 |
C |
$5,025,000 |
5.56% |
-0.66 |
— |
— |
|
 Raisel Iglesias
 |
RP |
$3,214,286 |
3.55% |
1.59 |
0.49 |
$2,021,792 |
|
 Zack Cozart
 |
SS |
$2,925,000 |
3.24% |
2.48 |
0.85 |
$1,180,416 |
|
 Alfredo Simon
 |
SP |
$2,000,000 |
2.21% |
-2.01 |
— |
— |
|
 J.J. Hoover
 |
RP |
$1,400,000 |
1.55% |
-0.40 |
— |
— |
|
 Ross Ohlendorf
 |
RP |
$800,000 |
0.88% |
-0.32 |
— |
— |
|
 Blake Wood
 |
RP |
$600,000 |
0.66% |
-0.13 |
— |
— |
|
 Billy Hamilton
 |
CF |
$570,000 |
0.63% |
2.46 |
4.32 |
$231,463 |
|
 Eugenio Suárez
 |
3B |
$545,000 |
0.60% |
2.35 |
4.31 |
$232,202 |
|
 Eugenio Velez
 |
DNP |
$545,000 |
0.60% |
— |
— |
— |
|
 Anthony DeSclafani
 |
SP |
$540,000 |
0.60% |
1.39 |
2.57 |
$388,481 |
|
 Tony Cingrani
 |
RP |
$530,000 |
0.59% |
-0.98 |
— |
— |
|
 Jumbo Díaz
 |
RP |
$525,000 |
0.58% |
0.07 |
0.13 |
$7,632,478 |
|
 Tucker Barnhart
 |
C |
$517,500 |
0.57% |
2.02 |
3.89 |
$256,783 |
|
 Iván De Jesús Jr.
 |
PH |
$517,000 |
0.57% |
0.50 |
0.97 |
$1,025,708 |
|
 Michael Lorenzen
 |
RP |
$516,500 |
0.57% |
0.86 |
1.66 |
$600,609 |
|
 Dan Straily
 |
SP |
$512,100 |
0.57% |
0.94 |
1.83 |
$547,677 |
|
 Brandon Finnegan
 |
SP |
$511,500 |
0.57% |
-1.50 |
— |
— |
|
 Adam Duvall
 |
LF |
$510,000 |
0.56% |
3.88 |
7.61 |
$131,450 |
|
 Caleb Cotham
 |
RP |
$509,675 |
0.56% |
0.08 |
0.16 |
$6,107,915 |
|
 Jon Moscot
 |
SP |
$508,000 |
0.56% |
-0.87 |
— |
— |
|
 Kyle Skipworth
 |
DNP |
$508,000 |
0.56% |
— |
— |
— |
|
 Yorman Rodriguez
 |
DNP |
$507,500 |
0.56% |
— |
— |
— |
|
 John Lamb
 |
SP |
$507,500 |
0.56% |
-1.30 |
— |
— |
|
 Scott Schebler
 |
RF |
$507,500 |
0.56% |
1.22 |
2.40 |
$416,841 |
|
 Keyvius Sampson
 |
RP |
$507,500 |
0.56% |
0.04 |
0.09 |
$11,743,580 |
|
 José Peraza
 |
SS |
$507,500 |
0.56% |
0.84 |
1.66 |
$602,639 |
|
 Tyler Holt
 |
PH |
$507,500 |
0.56% |
-0.32 |
— |
— |
|
| Player | Pos | Salary | Pct | WARP | WARP/$M | $/WARP | Current Status |
|---|
|
Anthony DeSclafani |
DNP |
$20,000,000 |
22.12% |
-0.66 | 0.31 | $54,530,252 |
|
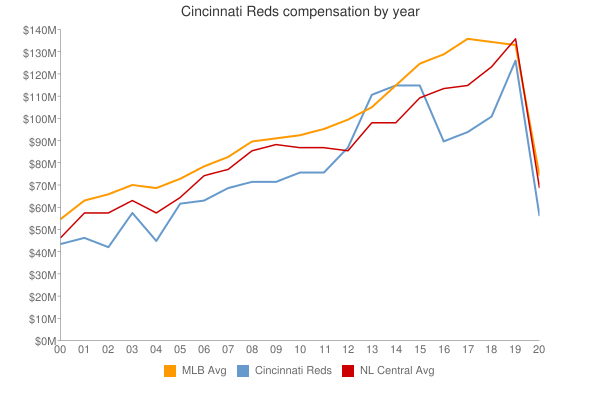
| Year | Reds payroll | Avg payroll | Diff |
|---|
| 2000 | $44,767,200 | $57,491,092 | $-12,723,892 |
| 2001 | $47,974,000 | $67,120,750 | $-19,146,750 |
| 2002 | $43,203,890 | $69,204,705 | $-26,000,815 |
| 2003 | $58,541,000 | $72,156,639 | $-13,615,639 |
| 2004 | $46,697,250 | $71,426,357 | $-24,729,107 |
| 2005 | $62,594,583 | $73,628,169 | $-11,033,586 |
| 2006 | $63,631,833 | $81,192,832 | $-17,560,999 |
| 2007 | $69,910,833 | $85,747,487 | $-15,836,654 |
| 2008 | $72,240,000 | $93,079,041 | $-20,839,041 |
| 2009 | $72,283,500 | $92,957,049 | $-20,673,549 |
| 2010 | $76,876,500 | $94,957,956 | $-18,081,456 |
| 2011 | $76,631,134 | $97,426,414 | $-20,795,280 |
| 2012 | $87,826,167 | $100,689,500 | $-12,863,333 |
| 2013 | $111,105,533 | $106,658,387 | $4,447,146 |
| 2014 | $115,384,724 | $115,428,670 | $-43,946 |
| 2015 | $115,373,953 | $125,458,486 | $-10,084,533 |
| 2016 | $90,416,228 | $130,290,910 | $-39,874,682 |
| 2017 | $95,375,786 | $136,573,000 | $-41,197,214 |
| 2018 | $101,337,500 | $135,681,867 | $-34,344,367 |
| 2019 | $127,218,214 | $134,776,225 | $-7,558,011 |
| 2020 | $145,670,792 | $138,321,485 | $7,349,307 |
| 2021 | $129,642,381 | $129,635,938 | $6,443 |
| 2022 | $107,955,000 | $147,002,411 | $-39,047,411 |
| 2023 | $94,198,333 | $158,155,877 | $-63,957,544 |
| 2024 | $100,758,333 | $133,074,721 | $-32,316,388 |
| 2025 | $74,483,333 | $94,180,059 | $-19,696,726 |
| 2026 | $45,483,333 | $74,818,461 | $-29,335,128 |
| 2027 | $42,483,333 | $56,972,319 | $-14,488,986 |
| 2028 | $16,333,333 | $45,437,759 | $-29,104,426 |
| 2029 | $2,000,000 | $37,269,628 | $-35,269,628 |
| Year | Reds payroll | Avg payroll | Diff |
|---|
| 2000 | $111,105,533 | $100,689,500 | $-12,723,892 | |
 2016 Cincinnati Reds