| Player | Pos | Salary | Pct | WARP | WARP/$M | $/WARP | Current Status |
|---|
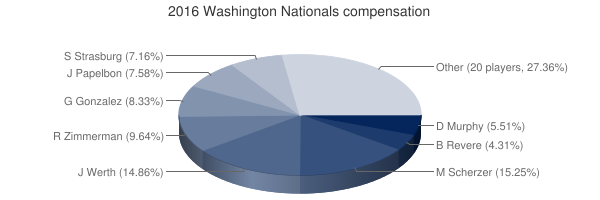
 Max Scherzer
 |
SP |
$22,142,857 |
15.25% |
7.92 |
0.36 |
$2,795,374 |
|
 Jayson Werth
 |
LF |
$21,571,429 |
14.86% |
2.03 |
0.09 |
$10,600,680 |
|
 Ryan Zimmerman
 |
1B |
$14,000,000 |
9.64% |
-0.17 |
— |
— |
|
 Gio González
 |
SP |
$12,100,000 |
8.33% |
3.58 |
0.30 |
$3,376,681 |
|
 Jonathan Papelbon
 |
RP |
$11,000,000 |
7.58% |
0.03 |
0.00 |
$418,542,180 |
|
 Stephen Strasburg
 |
SP |
$10,400,000 |
7.16% |
4.64 |
0.45 |
$2,240,829 |
|
 Daniel Murphy
 |
2B |
$8,000,000 |
5.51% |
7.09 |
0.89 |
$1,128,280 |
|
 Ben Revere
 |
CF |
$6,250,000 |
4.31% |
-0.94 |
— |
— |
|
 Wilson Ramos
 |
C |
$5,350,000 |
3.69% |
5.68 |
1.06 |
$941,789 |
|
 Bryce Harper
 |
RF |
$5,000,000 |
3.44% |
4.99 |
1.00 |
$1,001,863 |
|
 Shawn Kelley
 |
RP |
$4,000,000 |
2.76% |
1.72 |
0.43 |
$2,332,253 |
|
 Stephen Drew
 |
PH |
$3,000,000 |
2.07% |
1.63 |
0.54 |
$1,844,633 |
|
 Oliver Pérez
 |
RP |
$3,000,000 |
2.07% |
0.41 |
0.14 |
$7,266,544 |
|
 Danny Espinosa
 |
SS |
$2,875,000 |
1.98% |
3.45 |
1.20 |
$833,870 |
|
 Anthony Rendon
 |
3B |
$2,800,000 |
1.93% |
3.96 |
1.41 |
$706,846 |
|
 Yusmeiro Petit
 |
RP |
$2,500,000 |
1.72% |
0.41 |
0.16 |
$6,171,118 |
|
 Drew Storen
 |
DNP |
$2,125,000 |
1.46% |
— |
— |
— |
|
 Yunel Escobar
 |
DNP |
$1,500,000 |
1.03% |
— |
— |
— |
|
 Jose Lobaton
 |
C |
$1,387,500 |
0.96% |
0.57 |
0.41 |
$2,444,443 |
|
 Chris Heisey
 |
PH |
$1,250,000 |
0.86% |
0.57 |
0.46 |
$2,196,601 |
|
 Matt Belisle
 |
RP |
$1,250,000 |
0.86% |
0.47 |
0.37 |
$2,671,888 |
|
 Tanner Roark
 |
SP |
$543,400 |
0.37% |
4.10 |
7.54 |
$132,549 |
|
 Clint Robinson
 |
PH |
$534,900 |
0.37% |
-0.11 |
— |
— |
|
 Blake Treinen
 |
RP |
$524,900 |
0.36% |
0.29 |
0.55 |
$1,804,431 |
|
 Michael A. Taylor
 |
CF |
$524,000 |
0.36% |
0.69 |
1.31 |
$760,983 |
|
 Aaron Barrett
 |
DNP |
$519,400 |
0.36% |
— |
— |
— |
|
 Felipe Vázquez
 |
RP |
$516,100 |
0.36% |
1.25 |
2.43 |
$412,112 |
|
 Joe Ross
 |
SP |
$514,400 |
0.35% |
2.19 |
4.26 |
$234,560 |
|
| Player | Pos | Salary | Pct | WARP | WARP/$M | $/WARP | Current Status |
|---|
|
Jonathan Papelbon |
DNP |
$22,142,857 |
15.25% |
-0.17 | 0.36 | $418,542,180 |
|
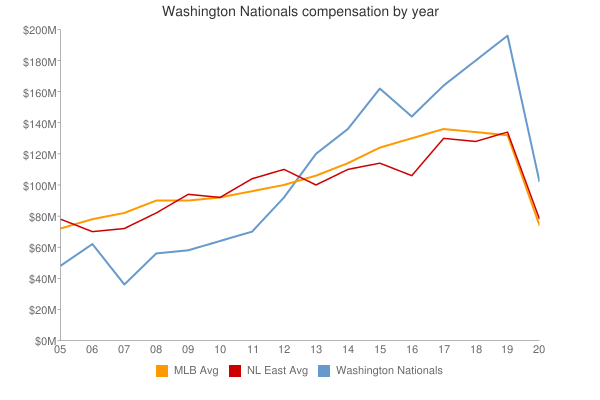
| Year | Nationals payroll | Avg payroll | Diff |
|---|
| 2005 | $48,613,000 | $73,628,169 | $-25,015,169 |
| 2006 | $62,520,000 | $81,192,832 | $-18,672,832 |
| 2007 | $37,347,500 | $85,747,487 | $-48,399,987 |
| 2008 | $56,261,000 | $93,079,041 | $-36,818,041 |
| 2009 | $59,878,000 | $92,957,049 | $-33,079,049 |
| 2010 | $65,275,000 | $94,957,956 | $-29,682,956 |
| 2011 | $70,794,429 | $97,426,414 | $-26,631,985 |
| 2012 | $92,534,929 | $100,689,500 | $-8,154,571 |
| 2013 | $121,289,679 | $106,658,387 | $14,631,292 |
| 2014 | $137,356,579 | $115,428,670 | $21,927,909 |
| 2015 | $162,014,559 | $125,458,486 | $36,556,073 |
| 2016 | $145,178,886 | $130,290,910 | $14,887,976 |
| 2017 | $164,335,444 | $136,573,000 | $27,762,444 |
| 2018 | $180,849,056 | $135,681,867 | $45,167,189 |
| 2019 | $197,203,691 | $134,776,225 | $62,427,466 |
| 2020 | $173,754,795 | $138,321,485 | $35,433,310 |
| 2021 | $172,772,247 | $129,635,938 | $43,136,309 |
| 2022 | $137,371,867 | $147,002,411 | $-9,630,544 |
| 2023 | $125,965,667 | $158,155,877 | $-32,190,210 |
| 2024 | $113,041,666 | $133,074,721 | $-20,033,055 |
| 2025 | $42,875,000 | $94,180,059 | $-51,305,059 |
| 2026 | $40,375,000 | $74,818,461 | $-34,443,461 |
| 2027 | $5,375,000 | $56,972,319 | $-51,597,319 |
| 2028 | $7,375,000 | $45,437,759 | $-38,062,759 |
| 2029 | $9,375,000 | $37,269,628 | $-27,894,628 |
| 2030 | $9,375,000 | $39,665,769 | $-30,290,769 |
| Year | Nationals payroll | Avg payroll | Diff |
|---|
| 2005 | $121,289,679 | $100,689,500 | $-25,015,169 | |
 2016 Washington Nationals