| Player | Player Sort | Pos | Salary | Salary Sort | Pct | Pct Sort | WARP | WARP Sort | WARP/$M | WARP/$M Sort | $/WARP | $/WARP Sort | Current Status |
|---|
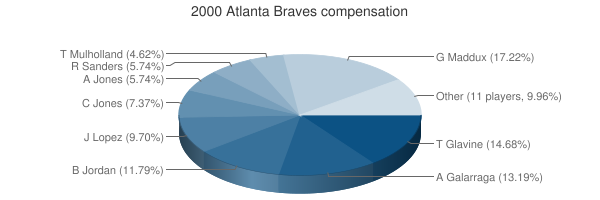
 Greg Maddux
 |
Maddux Greg |
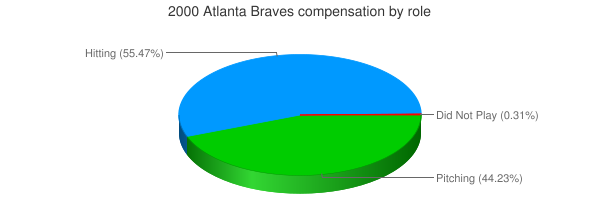
RP |
$11,100,000 |
11100000 |
13.48% |
13.48 |
10.60 |
10.6013 |
0.96 |
0.95507207207207 |
$1,047,041 |
1047041.4005829 |
|
 John Smoltz
 |
Smoltz John |
DNP |
$8,500,000 |
8500000 |
10.32% |
10.32 |
— |
0.00 |
— |
0 |
— |
0 |
|
 Tom Glavine
 |
Glavine Tom |
RP |
$8,500,000 |
8500000 |
10.32% |
10.32 |
7.21 |
7.21394 |
0.85 |
0.84869882352941 |
$1,178,274 |
1178274.2856192 |
|
 Andres Galarraga
 |
Galarraga Andres |
1B |
$8,500,000 |
8500000 |
10.32% |
10.32 |
0.63 |
0.627264 |
0.07 |
0.073795764705882 |
$13,550,913 |
13550913.172125 |
|
 Brian Jordan
 |
Jordan Brian |
RF |
$7,600,000 |
7600000 |
9.23% |
9.23 |
1.30 |
1.29883 |
0.17 |
0.17089868421053 |
$5,851,420 |
5851420.1242657 |
|
 Javy Lopez
 |
Lopez Javy |
C |
$6,250,000 |
6250000 |
7.59% |
7.59 |
5.27 |
5.27361 |
0.84 |
0.8437776 |
$1,185,146 |
1185146.417729 |
|
 Chipper Jones
 |
Jones Chipper |
3B |
$4,750,000 |
4750000 |
5.77% |
5.77 |
5.14 |
5.13606 |
1.08 |
1.0812757894737 |
$924,833 |
924833.43263124 |
|
 Andruw Jones
 |
Jones Andruw |
CF |
$3,700,000 |
3700000 |
4.49% |
4.49 |
6.71 |
6.70698 |
1.81 |
1.8126972972973 |
$551,664 |
551664.08726431 |
|
 Reggie Sanders
 |
Sanders Reggie |
LF |
$3,700,000 |
3700000 |
4.49% |
4.49 |
-0.38 |
-0.384571 |
— |
0 |
— |
0 |
|
 Wally Joyner
 |
Joyner Wally |
PH |
$3,375,000 |
3375000 |
4.10% |
4.10 |
0.79 |
0.792465 |
0.23 |
0.23480444444444 |
$4,258,863 |
4258863.1674585 |
|
 Walt Weiss
 |
Weiss Walt |
SS |
$3,000,000 |
3000000 |
3.64% |
3.64 |
1.36 |
1.36337 |
0.45 |
0.45445666666667 |
$2,200,430 |
2200429.817291 |
|
 Quilvio Veras
 |
Veras Quilvio |
2B |
$3,000,000 |
3000000 |
3.64% |
3.64 |
2.66 |
2.66281 |
0.89 |
0.88760333333333 |
$1,126,629 |
1126629.387752 |
|
 Terry Mulholland
 |
Mulholland Terry |
RP |
$2,975,000 |
2975000 |
3.61% |
3.61 |
1.34 |
1.33819 |
0.45 |
0.44981176470588 |
$2,223,152 |
2223152.1682272 |
|
 Rudy Seanez
 |
Seanez Rudy |
RP |
$1,650,000 |
1650000 |
2.00% |
2.00 |
0.24 |
0.242559 |
0.15 |
0.14700545454545 |
$6,802,469 |
6802468.6777238 |
|
 Mike Remlinger
 |
Remlinger Mike |
RP |
$1,400,000 |
1400000 |
1.70% |
1.70 |
1.63 |
1.62808 |
1.16 |
1.1629142857143 |
$859,909 |
859908.6039998 |
|
 Keith Lockhart
 |
Lockhart Keith |
2B |
$1,000,000 |
1000000 |
1.21% |
1.21 |
-0.07 |
-0.0713218 |
— |
0 |
— |
0 |
|
 John Burkett
 |
Burkett John |
RP |
$750,000 |
750000 |
0.91% |
0.91 |
3.18 |
3.1829 |
4.24 |
4.2438666666667 |
$235,634 |
235634.17009645 |
|
 Eddie Pérez
 |
Perez Eddie |
C |
$650,000 |
650000 |
0.79% |
0.79 |
-0.15 |
-0.14565 |
— |
0 |
— |
0 |
|
 Kevin Millwood
 |
Millwood Kevin |
RP |
$420,000 |
420000 |
0.51% |
0.51 |
5.26 |
5.25939 |
12.52 |
12.522357142857 |
$79,857 |
79857.169747822 |
|
 Trenidad Hubbard
 |
Hubbard Trenidad |
LF |
$400,000 |
400000 |
0.49% |
0.49 |
-0.40 |
-0.396217 |
— |
0 |
— |
0 |
|
 John Rocker
 |
Rocker John |
RP |
$290,000 |
290000 |
0.35% |
0.35 |
1.62 |
1.61771 |
5.58 |
5.5783103448276 |
$179,266 |
179265.75220528 |
|
 Kerry Ligtenberg
 |
Ligtenberg Kerry |
RP |
$255,000 |
255000 |
0.31% |
0.31 |
1.04 |
1.04233 |
4.09 |
4.087568627451 |
$244,644 |
244644.21056671 |
|
 Bruce Chen
 |
Chen Bruce |
RP |
$207,500 |
207500 |
0.25% |
0.25 |
1.15 |
1.1482 |
5.53 |
5.5334939759036 |
$180,718 |
180717.64500958 |
|
 Rafael Furcal
 |
Furcal Rafael |
SS |
$200,000 |
200000 |
0.24% |
0.24 |
3.42 |
3.42296 |
17.11 |
17.1148 |
$58,429 |
58428.962067918 |
|
 Doug Clark
 |
Clark Doug |
DNP |
$200,000 |
200000 |
0.24% |
0.24 |
— |
0.00 |
— |
0 |
— |
0 |
|
| Year | Braves payroll |
PR Sort |
Avg payroll |
AvgPR Sort |
Diff |
Diff Sort |
|---|
| 1988 | $62,500 | 62500 | $732,083 | 732083 | $-669,583 | -669583 |
| 1989 | $86,000 | 86000 | $763,625 | 763625 | $-677,625 | -677625 |
| 1990 | $210,000 | 210000 | $1,203,571 | 1203571 | $-993,571 | -993571 |
| 1991 | $355,000 | 355000 | $1,884,642 | 1884642 | $-1,529,642 | -1529642 |
| 1992 | $1,525,000 | 1525000 | $2,356,071 | 2356071 | $-831,071 | -831071 |
| 1993 | $2,500,000 | 2500000 | $3,410,000 | 3410000 | $-910,000 | -910000 |
| 1994 | $3,250,000 | 3250000 | $3,447,916 | 3447916 | $-197,916 | -197916 |
| 1995 | $4,750,000 | 4750000 | $4,591,041 | 4591041 | $158,959 | 158959 |
| 1996 | $5,609,000 | 5609000 | $4,109,148 | 4109148 | $1,499,852 | 1499852 |
| 1997 | $7,000,000 | 7000000 | $4,753,000 | 4753000 | $2,247,000 | 2247000 |
| 1998 | $7,750,000 | 7750000 | $6,661,904 | 6661904 | $1,088,096 | 1088096 |
| 1999 | $7,750,000 | 7750000 | $7,867,823 | 7867823 | $-117,823 | -117823 |
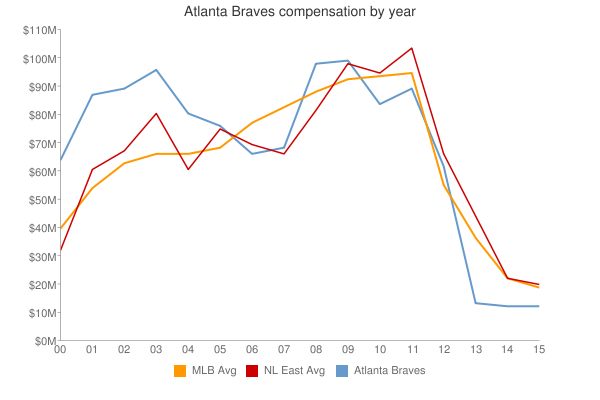
| 2000 | $82,372,500 | 82372500 | $55,368,142 | 55368142 | $27,004,358 | 27004358 |
| 2001 | $90,994,166 | 90994166 | $64,937,084 | 64937084 | $26,057,082 | 26057082 |
| 2002 | $92,460,367 | 92460367 | $67,238,672 | 67238672 | $25,221,695 | 25221695 |
| 2003 | $104,859,000 | 104859000 | $70,654,480 | 70654480 | $34,204,520 | 34204520 |
| 2004 | $90,107,500 | 90107500 | $69,466,729 | 69466729 | $20,640,771 | 20640771 |
| 2005 | $86,457,302 | 86457302 | $74,114,841 | 74114841 | $12,342,461 | 12342461 |
| 2006 | $89,820,876 | 89820876 | $79,621,815 | 79621815 | $10,199,061 | 10199061 |
| 2007 | $87,780,833 | 87780833 | $85,537,470 | 85537470 | $2,243,363 | 2243363 |
| 2008 | $103,069,017 | 103069017 | $92,003,799 | 92003799 | $11,065,218 | 11065218 |
| 2009 | $97,439,334 | 97439334 | $92,169,598 | 92169598 | $5,269,736 | 5269736 |
| 2010 | $84,390,334 | 84390334 | $94,342,601 | 94342601 | $-9,952,267 | -9952267 |
| 2011 | $92,202,417 | 92202417 | $96,974,710 | 96974710 | $-4,772,293 | -4772293 |
| 2012 | $93,529,667 | 93529667 | $100,947,217 | 100947217 | $-7,417,550 | -7417550 |
| 2013 | $90,039,583 | 90039583 | $108,586,966 | 108586966 | $-18,547,383 | -18547383 |
| 2014 | $112,865,874 | 112865874 | $117,131,361 | 117131361 | $-4,265,487 | -4265487 |
| 2015 | $97,443,604 | 97443604 | $126,168,161 | 126168161 | $-28,724,557 | -28724557 |
| 2016 | $86,580,792 | 86580792 | $131,756,569 | 131756569 | $-45,175,777 | -45175777 |
| 2017 | $122,603,054 | 122603054 | $136,337,445 | 136337445 | $-13,734,391 | -13734391 |
| 2018 | $118,284,851 | 118284851 | $135,360,600 | 135360600 | $-17,075,749 | -17075749 |
| 2019 | $128,247,089 | 128247089 | $134,792,134 | 134792134 | $-6,545,045 | -6545045 |
| 2020 | $149,673,875 | 149673875 | $139,496,467 | 139496467 | $10,177,408 | 10177408 |
| 2021 | $131,158,375 | 131158375 | $130,712,288 | 130712288 | $446,087 | 446087 |
| 2022 | $176,255,000 | 176255000 | $149,802,695 | 149802695 | $26,452,305 | 26452305 |
| 2023 | $202,857,500 | 202857500 | $161,692,345 | 161692345 | $41,165,155 | 41165155 |
| 2024 | $226,815,000 | 226815000 | $136,306,249 | 136306249 | $90,508,751 | 90508751 |
| 2025 | $144,750,000 | 144750000 | $98,329,527 | 98329527 | $46,420,473 | 46420473 |
| 2026 | $104,750,000 | 104750000 | $78,039,273 | 78039273 | $26,710,727 | 26710727 |
| 2027 | $85,000,000 | 85000000 | $60,919,343 | 60919343 | $24,080,657 | 24080657 |
| 2028 | $76,000,000 | 76000000 | $46,901,712 | 46901712 | $29,098,288 | 29098288 |
| 2029 | $59,000,000 | 59000000 | $38,597,944 | 38597944 | $20,402,056 | 20402056 |
| 2030 | $34,000,000 | 34000000 | $41,447,579 | 41447579 | $-7,447,579 | -7447579 |
| 2031 | $27,000,000 | 27000000 | $38,360,152 | 38360152 | $-11,360,152 | -11360152 |
| 2032 | $22,000,000 | 22000000 | $47,925,459 | 47925459 | $-25,925,459 | -25925459 |
|
 2000 Atlanta Braves