| Player | Player Sort | Pos | Salary | Salary Sort | Pct | Pct Sort | WARP | WARP Sort | WARP/$M | WARP/$M Sort | $/WARP | $/WARP Sort | Current Status |
|---|
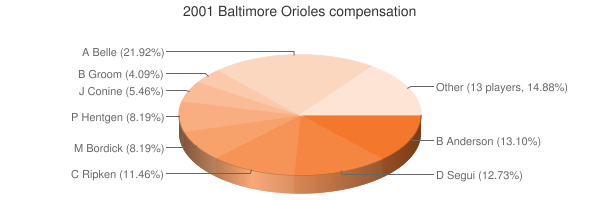
 Albert Belle
 |
Belle Albert |
DNP |
$12,049,040 |
12049040 |
16.31% |
16.31 |
— |
0.00 |
— |
0 |
— |
0 |
|
 Brady Anderson
 |
Anderson Brady |
RF |
$7,200,000 |
7200000 |
9.74% |
9.74 |
-0.22 |
-0.22222 |
— |
0 |
— |
0 |
|
 David Segui
 |
Segui David |
1B |
$7,000,000 |
7000000 |
9.47% |
9.47 |
1.96 |
1.96228 |
0.28 |
0.28032571428571 |
$3,567,279 |
3567278.8796706 |
|
 Scott Erickson
 |
Erickson Scott |
DNP |
$6,680,000 |
6680000 |
9.04% |
9.04 |
— |
0.00 |
— |
0 |
— |
0 |
|
 Cal Ripken Jr.
 |
Ripken Cal |
3B |
$6,300,000 |
6300000 |
8.53% |
8.53 |
-0.16 |
-0.164977 |
— |
0 |
— |
0 |
|
 Pat Hentgen
 |
Hentgen Pat |
RP |
$4,500,000 |
4500000 |
6.09% |
6.09 |
0.68 |
0.676671 |
0.15 |
0.15037133333333 |
$6,650,204 |
6650203.7179072 |
|
 Mike Bordick
 |
Bordick Mike |
SS |
$4,500,000 |
4500000 |
6.09% |
6.09 |
0.62 |
0.619099 |
0.14 |
0.13757755555556 |
$7,268,627 |
7268627.4731505 |
|
 Delino DeShields
 |
DeShields Delino |
LF |
$4,333,667 |
4333667 |
5.86% |
5.86 |
-0.56 |
-0.555702 |
— |
0 |
— |
0 |
|
 Jeff Conine
 |
Conine Jeff |
1B |
$3,000,000 |
3000000 |
4.06% |
4.06 |
3.34 |
3.34206 |
1.11 |
1.11402 |
$897,650 |
897649.95242455 |
|
 Alan Mills
 |
Mills Alan |
RP |
$3,000,000 |
3000000 |
4.06% |
4.06 |
-0.34 |
-0.337128 |
— |
0 |
— |
0 |
|
 Jose Mercedes
 |
Mercedes Jose |
RP |
$2,750,000 |
2750000 |
3.72% |
3.72 |
1.07 |
1.07373 |
0.39 |
0.39044727272727 |
$2,561,165 |
2561165.2836374 |
|
 Mike Trombley
 |
Trombley Mike |
RP |
$2,333,333 |
2333333 |
3.16% |
3.16 |
0.82 |
0.816131 |
0.35 |
0.34977047853864 |
$2,859,018 |
2859017.7312221 |
|
 Buddy Groom
 |
Groom Buddy |
RP |
$2,250,000 |
2250000 |
3.04% |
3.04 |
1.50 |
1.4972 |
0.67 |
0.66542222222222 |
$1,502,805 |
1502805.2364414 |
|
 Sidney Ponson
 |
Ponson Sidney |
RP |
$2,100,000 |
2100000 |
2.84% |
2.84 |
0.91 |
0.906651 |
0.43 |
0.43173857142857 |
$2,316,216 |
2316216.4934468 |
|
 Chuck McElroy
 |
McElroy Chuck |
RP |
$1,520,000 |
1520000 |
2.06% |
2.06 |
-0.42 |
-0.424515 |
— |
0 |
— |
0 |
|
 Greg Myers
 |
Myers Greg |
DH |
$1,400,000 |
1400000 |
1.89% |
1.89 |
0.39 |
0.385017 |
0.28 |
0.27501214285714 |
$3,636,203 |
3636203.0767473 |
|
 Brook Fordyce
 |
Fordyce Brook |
C |
$825,000 |
825000 |
1.12% |
1.12 |
-0.03 |
-0.0334443 |
— |
0 |
— |
0 |
|
 Jason Johnson
 |
Johnson Jason |
RP |
$350,000 |
350000 |
0.47% |
0.47 |
-0.70 |
-0.703849 |
— |
0 |
— |
0 |
|
 Melvin Mora
 |
Mora Melvin |
CF |
$270,000 |
270000 |
0.37% |
0.37 |
2.10 |
2.09747 |
7.77 |
7.7684074074074 |
$128,727 |
128726.51337087 |
|
 Jerry Hairston
 |
Hairston Jerry |
2B |
$235,000 |
235000 |
0.32% |
0.32 |
0.20 |
0.204807 |
0.87 |
0.87151914893617 |
$1,147,422 |
1147421.7189842 |
|
 Chris Richard
 |
Richard Chris |
RF |
$232,500 |
232500 |
0.31% |
0.31 |
2.21 |
2.20842 |
9.50 |
9.4985806451613 |
$105,279 |
105278.8871682 |
|
 Ryan Kohlmeier
 |
Kohlmeier Ryan |
RP |
$230,000 |
230000 |
0.31% |
0.31 |
-0.43 |
-0.427001 |
— |
0 |
— |
0 |
|
 Luis Matos
 |
Matos Luis |
CF |
$226,000 |
226000 |
0.31% |
0.31 |
0.47 |
0.466214 |
2.06 |
2.0628938053097 |
$484,756 |
484755.92753542 |
|
 B.J. Ryan
 |
Ryan B.J. |
RP |
$210,000 |
210000 |
0.28% |
0.28 |
0.84 |
0.837764 |
3.99 |
3.9893523809524 |
$250,667 |
250667.25235269 |
|
 Willis Roberts
 |
Roberts Willis |
RP |
$200,000 |
200000 |
0.27% |
0.27 |
1.21 |
1.21128 |
6.06 |
6.0564 |
$165,115 |
165114.58952513 |
|
 Jay Gibbons
 |
Gibbons Jay |
LF |
$200,000 |
200000 |
0.27% |
0.27 |
0.88 |
0.881217 |
4.41 |
4.406085 |
$226,959 |
226958.85349466 |
|
| Year | Orioles payroll |
PR Sort |
Avg payroll |
AvgPR Sort |
Diff |
Diff Sort |
|---|
| 2000 | $82,250,111 | 82250111 | $55,368,142 | 55368142 | $26,881,969 | 26881969 |
| 2001 | $73,894,540 | 73894540 | $64,937,084 | 64937084 | $8,957,456 | 8957456 |
| 2002 | $60,496,987 | 60496987 | $67,238,672 | 67238672 | $-6,741,685 | -6741685 |
| 2003 | $73,282,500 | 73282500 | $70,654,480 | 70654480 | $2,628,020 | 2628020 |
| 2004 | $53,273,333 | 53273333 | $69,466,729 | 69466729 | $-16,193,396 | -16193396 |
| 2005 | $73,066,833 | 73066833 | $74,114,841 | 74114841 | $-1,048,008 | -1048008 |
| 2006 | $83,729,266 | 83729266 | $79,621,815 | 79621815 | $4,107,451 | 4107451 |
| 2007 | $94,056,726 | 94056726 | $85,537,470 | 85537470 | $8,519,256 | 8519256 |
| 2008 | $66,644,581 | 66644581 | $92,003,799 | 92003799 | $-25,359,218 | -25359218 |
| 2009 | $68,369,792 | 68369792 | $92,169,598 | 92169598 | $-23,799,806 | -23799806 |
| 2010 | $75,412,500 | 75412500 | $94,342,601 | 94342601 | $-18,930,101 | -18930101 |
| 2011 | $88,184,250 | 88184250 | $96,974,710 | 96974710 | $-8,790,460 | -8790460 |
| 2012 | $84,769,000 | 84769000 | $100,947,217 | 100947217 | $-16,178,217 | -16178217 |
| 2013 | $92,238,334 | 92238334 | $108,586,966 | 108586966 | $-16,348,632 | -16348632 |
| 2014 | $107,976,154 | 107976154 | $117,131,361 | 117131361 | $-9,155,207 | -9155207 |
| 2015 | $118,975,833 | 118975833 | $126,168,161 | 126168161 | $-7,192,328 | -7192328 |
| 2016 | $147,693,714 | 147693714 | $131,756,569 | 131756569 | $15,937,145 | 15937145 |
| 2017 | $164,326,172 | 164326172 | $136,337,445 | 136337445 | $27,988,727 | 27988727 |
| 2018 | $148,574,615 | 148574615 | $135,360,600 | 135360600 | $13,214,015 | 13214015 |
| 2019 | $80,814,882 | 80814882 | $134,792,134 | 134792134 | $-53,977,252 | -53977252 |
| 2020 | $62,285,088 | 62285088 | $139,496,467 | 139496467 | $-77,211,379 | -77211379 |
| 2021 | $62,525,283 | 62525283 | $130,712,288 | 130712288 | $-68,187,005 | -68187005 |
| 2022 | $43,068,167 | 43068167 | $149,802,695 | 149802695 | $-106,734,528 | -106734528 |
| 2023 | $66,889,067 | 66889067 | $161,692,345 | 161692345 | $-94,803,278 | -94803278 |
| 2024 | $52,645,666 | 52645666 | $136,306,249 | 136306249 | $-83,660,583 | -83660583 |
| 2025 | $2,000,000 | 2000000 | $98,329,527 | 98329527 | $-96,329,527 | -96329527 |
|
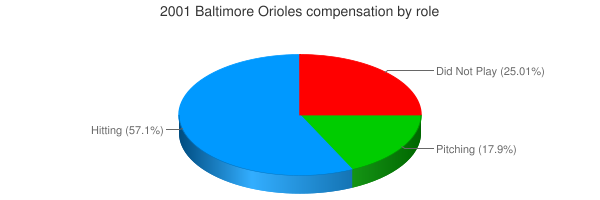
 2001 Baltimore Orioles