| Player | Player Sort | Pos | Salary | Salary Sort | Pct | Pct Sort | WARP | WARP Sort | WARP/$M | WARP/$M Sort | $/WARP | $/WARP Sort | Current Status |
|---|
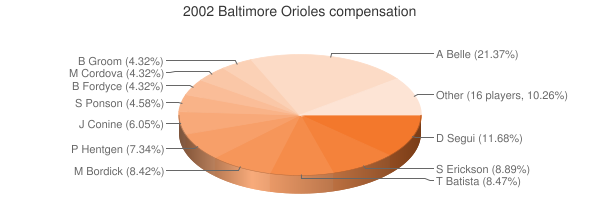
 Albert Belle
 |
Belle Albert |
DNP |
$12,368,790 |
12368790 |
20.45% |
20.45 |
— |
0.00 |
— |
0 |
— |
0 |
|
 David Segui
 |
Segui David |
DH |
$6,762,895 |
6762895 |
11.18% |
11.18 |
-0.12 |
-0.123085 |
— |
0 |
— |
0 |
|
 Scott Erickson
 |
Erickson Scott |
RP |
$5,142,986 |
5142986 |
8.50% |
8.50 |
-1.89 |
-1.88507 |
— |
0 |
— |
0 |
|
 Tony Batista
 |
Batista Tony |
3B |
$4,900,000 |
4900000 |
8.10% |
8.10 |
2.83 |
2.8274 |
0.58 |
0.57702040816327 |
$1,733,041 |
1733040.9563557 |
|
 Mike Bordick
 |
Bordick Mike |
SS |
$4,873,439 |
4873439 |
8.06% |
8.06 |
1.38 |
1.37838 |
0.28 |
0.2828351806599 |
$3,535,628 |
3535628.0561239 |
|
 Pat Hentgen
 |
Hentgen Pat |
RP |
$4,246,877 |
4246877 |
7.02% |
7.02 |
-0.48 |
-0.477377 |
— |
0 |
— |
0 |
|
 Jeff Conine
 |
Conine Jeff |
1B |
$3,500,000 |
3500000 |
5.79% |
5.79 |
0.41 |
0.407823 |
0.12 |
0.11652085714286 |
$8,582,155 |
8582154.5131099 |
|
 Sidney Ponson
 |
Ponson Sidney |
RP |
$2,650,000 |
2650000 |
4.38% |
4.38 |
1.00 |
0.995902 |
0.38 |
0.3758120754717 |
$2,660,904 |
2660904.3861745 |
|
 Marty Cordova
 |
Cordova Marty |
LF |
$2,500,000 |
2500000 |
4.13% |
4.13 |
0.33 |
0.330749 |
0.13 |
0.1322996 |
$7,558,602 |
7558601.840066 |
|
 Brook Fordyce
 |
Fordyce Brook |
C |
$2,500,000 |
2500000 |
4.13% |
4.13 |
0.17 |
0.16826 |
0.07 |
0.067304 |
$14,857,958 |
14857957.922263 |
|
 Buddy Groom
 |
Groom Buddy |
RP |
$2,500,000 |
2500000 |
4.13% |
4.13 |
1.46 |
1.46029 |
0.58 |
0.584116 |
$1,711,989 |
1711988.7145704 |
|
 Jason Johnson
 |
Johnson Jason |
RP |
$1,800,000 |
1800000 |
2.98% |
2.98 |
1.05 |
1.0456 |
0.58 |
0.58088888888889 |
$1,721,500 |
1721499.6174445 |
|
 Chris Singleton
 |
Singleton Chris |
CF |
$1,400,000 |
1400000 |
2.31% |
2.31 |
-0.03 |
-0.0265137 |
— |
0 |
— |
0 |
|
 Chris Brock
 |
Brock Chris |
RP |
$1,000,000 |
1000000 |
1.65% |
1.65 |
-0.36 |
-0.364736 |
— |
0 |
— |
0 |
|
 Luis Lopez
 |
Lopez Luis |
PH |
$700,000 |
700000 |
1.16% |
1.16 |
-0.51 |
-0.513736 |
— |
0 |
— |
0 |
|
 Melvin Mora
 |
Mora Melvin |
LF |
$350,000 |
350000 |
0.58% |
0.58 |
4.80 |
4.7964 |
13.70 |
13.704 |
$72,971 |
72971.395213076 |
|
 Chris Richard
 |
Richard Chris |
DH |
$300,000 |
300000 |
0.50% |
0.50 |
-0.41 |
-0.40837 |
— |
0 |
— |
0 |
|
 B.J. Ryan
 |
Ryan B.J. |
RP |
$300,000 |
300000 |
0.50% |
0.50 |
0.63 |
0.629518 |
2.10 |
2.0983933333333 |
$476,555 |
476555.07864747 |
|
 Jerry Hairston
 |
Hairston Jerry |
2B |
$300,000 |
300000 |
0.50% |
0.50 |
2.29 |
2.2897 |
7.63 |
7.6323333333333 |
$131,022 |
131021.53120496 |
|
 Willis Roberts
 |
Roberts Willis |
RP |
$260,000 |
260000 |
0.43% |
0.43 |
0.13 |
0.13363 |
0.51 |
0.51396153846154 |
$1,945,671 |
1945670.8822869 |
|
 Josh Towers
 |
Towers Josh |
RP |
$245,000 |
245000 |
0.40% |
0.40 |
-0.35 |
-0.34872 |
— |
0 |
— |
0 |
|
 Jay Gibbons
 |
Gibbons Jay |
RF |
$232,500 |
232500 |
0.38% |
0.38 |
1.97 |
1.97124 |
8.48 |
8.4784516129032 |
$117,946 |
117946.06440616 |
|
 Luis Matos
 |
Matos Luis |
RF |
$230,000 |
230000 |
0.38% |
0.38 |
-0.59 |
-0.59302 |
— |
0 |
— |
0 |
|
 Jorge Julio
 |
Julio Jorge |
RP |
$216,000 |
216000 |
0.36% |
0.36 |
0.93 |
0.929428 |
4.30 |
4.3029074074074 |
$232,401 |
232401.00362804 |
|
 John Parrish
 |
Parrish John |
DNP |
$215,000 |
215000 |
0.36% |
0.36 |
— |
0.00 |
— |
0 |
— |
0 |
|
 Will Ohman
 |
Ohman Will |
DNP |
$203,500 |
203500 |
0.34% |
0.34 |
— |
0.00 |
— |
0 |
— |
0 |
|
 Geronimo Gil
 |
Gil Geronimo |
C |
$200,000 |
200000 |
0.33% |
0.33 |
-1.15 |
-1.14868 |
— |
0 |
— |
0 |
|
 Rodrigo Lopez
 |
Lopez Rodrigo |
RP |
$200,000 |
200000 |
0.33% |
0.33 |
3.11 |
3.1081 |
15.54 |
15.5405 |
$64,348 |
64347.993951289 |
|
 Rick Bauer
 |
Bauer Rick |
RP |
$200,000 |
200000 |
0.33% |
0.33 |
-0.24 |
-0.24415 |
— |
0 |
— |
0 |
|
 Steve Green
 |
Green Steve |
DNP |
$200,000 |
200000 |
0.33% |
0.33 |
— |
0.00 |
— |
0 |
— |
0 |
|
| Year | Orioles payroll |
PR Sort |
Avg payroll |
AvgPR Sort |
Diff |
Diff Sort |
|---|
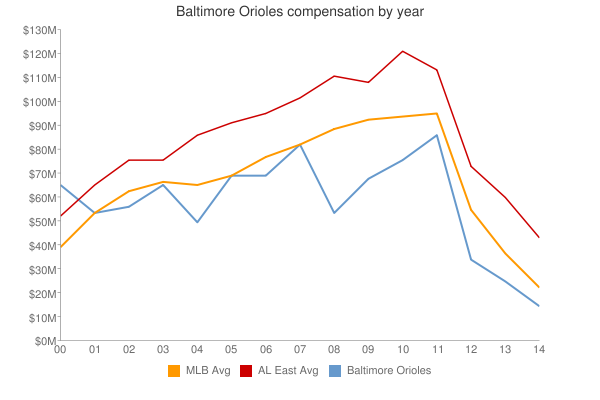
| 2000 | $82,250,111 | 82250111 | $55,368,142 | 55368142 | $26,881,969 | 26881969 |
| 2001 | $73,894,540 | 73894540 | $64,937,084 | 64937084 | $8,957,456 | 8957456 |
| 2002 | $60,496,987 | 60496987 | $67,238,672 | 67238672 | $-6,741,685 | -6741685 |
| 2003 | $73,282,500 | 73282500 | $70,654,480 | 70654480 | $2,628,020 | 2628020 |
| 2004 | $53,273,333 | 53273333 | $69,466,729 | 69466729 | $-16,193,396 | -16193396 |
| 2005 | $73,066,833 | 73066833 | $74,114,841 | 74114841 | $-1,048,008 | -1048008 |
| 2006 | $83,729,266 | 83729266 | $79,621,815 | 79621815 | $4,107,451 | 4107451 |
| 2007 | $94,056,726 | 94056726 | $85,537,470 | 85537470 | $8,519,256 | 8519256 |
| 2008 | $66,644,581 | 66644581 | $92,003,799 | 92003799 | $-25,359,218 | -25359218 |
| 2009 | $68,369,792 | 68369792 | $92,169,598 | 92169598 | $-23,799,806 | -23799806 |
| 2010 | $75,412,500 | 75412500 | $94,342,601 | 94342601 | $-18,930,101 | -18930101 |
| 2011 | $88,184,250 | 88184250 | $96,974,710 | 96974710 | $-8,790,460 | -8790460 |
| 2012 | $84,769,000 | 84769000 | $100,947,217 | 100947217 | $-16,178,217 | -16178217 |
| 2013 | $92,238,334 | 92238334 | $108,586,966 | 108586966 | $-16,348,632 | -16348632 |
| 2014 | $107,976,154 | 107976154 | $117,131,361 | 117131361 | $-9,155,207 | -9155207 |
| 2015 | $118,975,833 | 118975833 | $126,168,161 | 126168161 | $-7,192,328 | -7192328 |
| 2016 | $147,693,714 | 147693714 | $131,756,569 | 131756569 | $15,937,145 | 15937145 |
| 2017 | $164,326,172 | 164326172 | $136,337,445 | 136337445 | $27,988,727 | 27988727 |
| 2018 | $148,574,615 | 148574615 | $135,360,600 | 135360600 | $13,214,015 | 13214015 |
| 2019 | $80,814,882 | 80814882 | $134,792,134 | 134792134 | $-53,977,252 | -53977252 |
| 2020 | $62,285,088 | 62285088 | $139,496,467 | 139496467 | $-77,211,379 | -77211379 |
| 2021 | $62,525,283 | 62525283 | $130,712,288 | 130712288 | $-68,187,005 | -68187005 |
| 2022 | $43,068,167 | 43068167 | $149,802,695 | 149802695 | $-106,734,528 | -106734528 |
| 2023 | $66,889,067 | 66889067 | $161,692,345 | 161692345 | $-94,803,278 | -94803278 |
| 2024 | $52,645,666 | 52645666 | $136,306,249 | 136306249 | $-83,660,583 | -83660583 |
| 2025 | $2,000,000 | 2000000 | $98,329,527 | 98329527 | $-96,329,527 | -96329527 |
|
 2002 Baltimore Orioles