| Player | Player Sort | Pos | Salary | Salary Sort | Pct | Pct Sort | WARP | WARP Sort | WARP/$M | WARP/$M Sort | $/WARP | $/WARP Sort | Current Status |
|---|
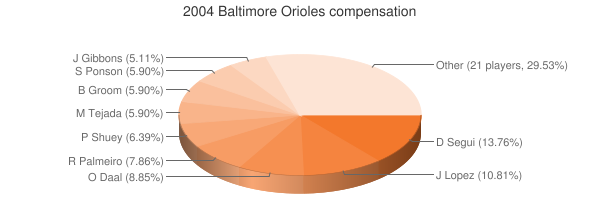
 David Segui
 |
Segui David |
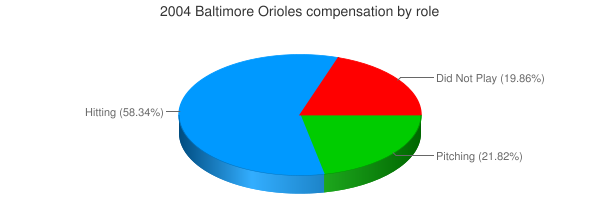
DH |
$7,000,000 |
7000000 |
13.14% |
13.14 |
0.02 |
0.0236363 |
0.00 |
0.0033766142857143 |
$296,154,643 |
296154643.49327 |
|
 Javy Lopez
 |
Lopez Javy |
C |
$5,500,000 |
5500000 |
10.32% |
10.32 |
3.77 |
3.77336 |
0.69 |
0.68606545454545 |
$1,457,587 |
1457586.8721776 |
|
 Miguel Tejada
 |
Tejada Miguel |
SS |
$5,000,000 |
5000000 |
9.39% |
9.39 |
8.49 |
8.49328 |
1.70 |
1.698656 |
$588,701 |
588700.71397623 |
|
 Omar Daal
 |
Daal Omar |
DNP |
$4,500,000 |
4500000 |
8.45% |
8.45 |
— |
0.00 |
— |
0 |
— |
0 |
|
 Rafael Palmeiro
 |
Palmeiro Rafael |
1B |
$4,000,000 |
4000000 |
7.51% |
7.51 |
0.51 |
0.509585 |
0.13 |
0.12739625 |
$7,849,525 |
7849524.6131656 |
|
 Marty Cordova
 |
Cordova Marty |
DNP |
$3,500,000 |
3500000 |
6.57% |
6.57 |
— |
0.00 |
— |
0 |
— |
0 |
|
 Sidney Ponson
 |
Ponson Sidney |
RP |
$3,000,000 |
3000000 |
5.63% |
5.63 |
0.01 |
0.0114919 |
0.00 |
0.0038306333333333 |
$261,053,438 |
261053437.63868 |
|
 Buddy Groom
 |
Groom Buddy |
RP |
$3,000,000 |
3000000 |
5.63% |
5.63 |
-0.03 |
-0.0322114 |
— |
0 |
— |
0 |
|
 Jay Gibbons
 |
Gibbons Jay |
RF |
$2,600,000 |
2600000 |
4.88% |
4.88 |
-0.85 |
-0.845551 |
— |
0 |
— |
0 |
|
 Melvin Mora
 |
Mora Melvin |
3B |
$2,333,333 |
2333333 |
4.38% |
4.38 |
5.42 |
5.4206 |
2.32 |
2.3231146175878 |
$430,457 |
430456.59152123 |
|
 Bubba Trammell
 |
Trammell Bubba |
DNP |
$1,850,000 |
1850000 |
3.47% |
3.47 |
— |
0.00 |
— |
0 |
— |
0 |
|
 Jerry Hairston
 |
Hairston Jerry |
RF |
$1,650,000 |
1650000 |
3.10% |
3.10 |
1.05 |
1.05188 |
0.64 |
0.63750303030303 |
$1,568,620 |
1568619.9946762 |
|
 Mike DeJean
 |
DeJean Mike |
RP |
$1,500,000 |
1500000 |
2.82% |
2.82 |
0.49 |
0.487114 |
0.32 |
0.32474266666667 |
$3,079,361 |
3079361.2994084 |
|
 B.J. Ryan
 |
Ryan B.J. |
RP |
$1,275,000 |
1275000 |
2.39% |
2.39 |
3.26 |
3.26064 |
2.56 |
2.5573647058824 |
$391,028 |
391027.52833799 |
|
 Luis Matos
 |
Matos Luis |
CF |
$975,000 |
975000 |
1.83% |
1.83 |
-1.31 |
-1.30631 |
— |
0 |
— |
0 |
|
 B.J. Surhoff
 |
Surhoff B.J. |
RF |
$800,000 |
800000 |
1.50% |
1.50 |
1.18 |
1.17922 |
1.47 |
1.474025 |
$678,415 |
678414.54520785 |
|
 Keith Osik
 |
Osik Keith |
C |
$500,000 |
500000 |
0.94% |
0.94 |
-0.53 |
-0.534907 |
— |
0 |
— |
0 |
|
 Jorge Julio
 |
Julio Jorge |
RP |
$385,000 |
385000 |
0.72% |
0.72 |
0.95 |
0.949421 |
2.47 |
2.4660285714286 |
$405,510 |
405510.30575477 |
|
 Luis Lopez
 |
Lopez Luis |
PH |
$365,000 |
365000 |
0.69% |
0.69 |
-0.67 |
-0.671715 |
— |
0 |
— |
0 |
|
 Rodrigo Lopez
 |
Lopez Rodrigo |
RP |
$365,000 |
365000 |
0.69% |
0.69 |
2.05 |
2.05386 |
5.63 |
5.6270136986301 |
$177,714 |
177714.15773227 |
|
 Brian Roberts
 |
Roberts Brian |
2B |
$345,000 |
345000 |
0.65% |
0.65 |
2.10 |
2.10123 |
6.09 |
6.0905217391304 |
$164,190 |
164189.54612299 |
|
 Larry Bigbie
 |
Bigbie Larry |
LF |
$340,000 |
340000 |
0.64% |
0.64 |
2.21 |
2.20914 |
6.50 |
6.4974705882353 |
$153,906 |
153906.04488625 |
|
 Rick Bauer
 |
Bauer Rick |
RP |
$335,000 |
335000 |
0.63% |
0.63 |
0.47 |
0.467804 |
1.40 |
1.3964298507463 |
$716,112 |
716111.87591384 |
|
 John Parrish
 |
Parrish John |
RP |
$320,000 |
320000 |
0.60% |
0.60 |
0.37 |
0.365823 |
1.14 |
1.143196875 |
$874,740 |
874739.96987614 |
|
 Kurt Ainsworth
 |
Ainsworth Kurt |
RP |
$315,000 |
315000 |
0.59% |
0.59 |
-0.55 |
-0.55211 |
— |
0 |
— |
0 |
|
 Matt Riley
 |
Riley Matt |
RP |
$310,000 |
310000 |
0.58% |
0.58 |
-0.37 |
-0.369149 |
— |
0 |
— |
0 |
|
 Eric DuBose
 |
DuBose Eric |
RP |
$305,000 |
305000 |
0.57% |
0.57 |
-1.05 |
-1.04954 |
— |
0 |
— |
0 |
|
 Jack Cust
 |
Cust Jack |
PH |
$305,000 |
305000 |
0.57% |
0.57 |
-0.02 |
-0.0226756 |
— |
0 |
— |
0 |
|
 Denny Bautista
 |
Bautista Denny |
RP |
$300,000 |
300000 |
0.56% |
0.56 |
-0.08 |
-0.0814858 |
— |
0 |
— |
0 |
|
 José Bautista
 |
Bautista Jose |
PR |
$300,000 |
300000 |
0.56% |
0.56 |
-0.07 |
-0.0658291 |
— |
0 |
— |
0 |
|
| Year | Orioles payroll |
PR Sort |
Avg payroll |
AvgPR Sort |
Diff |
Diff Sort |
|---|
| 2000 | $82,250,111 | 82250111 | $55,368,142 | 55368142 | $26,881,969 | 26881969 |
| 2001 | $73,894,540 | 73894540 | $64,937,084 | 64937084 | $8,957,456 | 8957456 |
| 2002 | $60,496,987 | 60496987 | $67,238,672 | 67238672 | $-6,741,685 | -6741685 |
| 2003 | $73,282,500 | 73282500 | $70,654,480 | 70654480 | $2,628,020 | 2628020 |
| 2004 | $53,273,333 | 53273333 | $69,466,729 | 69466729 | $-16,193,396 | -16193396 |
| 2005 | $73,066,833 | 73066833 | $74,114,841 | 74114841 | $-1,048,008 | -1048008 |
| 2006 | $83,729,266 | 83729266 | $79,621,815 | 79621815 | $4,107,451 | 4107451 |
| 2007 | $94,056,726 | 94056726 | $85,537,470 | 85537470 | $8,519,256 | 8519256 |
| 2008 | $66,644,581 | 66644581 | $92,003,799 | 92003799 | $-25,359,218 | -25359218 |
| 2009 | $68,369,792 | 68369792 | $92,169,598 | 92169598 | $-23,799,806 | -23799806 |
| 2010 | $75,412,500 | 75412500 | $94,342,601 | 94342601 | $-18,930,101 | -18930101 |
| 2011 | $88,184,250 | 88184250 | $96,974,710 | 96974710 | $-8,790,460 | -8790460 |
| 2012 | $84,769,000 | 84769000 | $100,947,217 | 100947217 | $-16,178,217 | -16178217 |
| 2013 | $92,238,334 | 92238334 | $108,586,966 | 108586966 | $-16,348,632 | -16348632 |
| 2014 | $107,976,154 | 107976154 | $117,131,361 | 117131361 | $-9,155,207 | -9155207 |
| 2015 | $118,975,833 | 118975833 | $126,168,161 | 126168161 | $-7,192,328 | -7192328 |
| 2016 | $147,693,714 | 147693714 | $131,756,569 | 131756569 | $15,937,145 | 15937145 |
| 2017 | $164,326,172 | 164326172 | $136,337,445 | 136337445 | $27,988,727 | 27988727 |
| 2018 | $148,574,615 | 148574615 | $135,360,600 | 135360600 | $13,214,015 | 13214015 |
| 2019 | $80,814,882 | 80814882 | $134,792,134 | 134792134 | $-53,977,252 | -53977252 |
| 2020 | $62,285,088 | 62285088 | $139,496,467 | 139496467 | $-77,211,379 | -77211379 |
| 2021 | $62,525,283 | 62525283 | $130,712,288 | 130712288 | $-68,187,005 | -68187005 |
| 2022 | $43,068,167 | 43068167 | $149,802,695 | 149802695 | $-106,734,528 | -106734528 |
| 2023 | $66,889,067 | 66889067 | $161,692,345 | 161692345 | $-94,803,278 | -94803278 |
| 2024 | $52,645,666 | 52645666 | $136,306,249 | 136306249 | $-83,660,583 | -83660583 |
| 2025 | $2,000,000 | 2000000 | $98,329,527 | 98329527 | $-96,329,527 | -96329527 |
|
 2004 Baltimore Orioles