| Player | Player Sort | Pos | Salary | Salary Sort | Pct | Pct Sort | WARP | WARP Sort | WARP/$M | WARP/$M Sort | $/WARP | $/WARP Sort | Current Status |
|---|
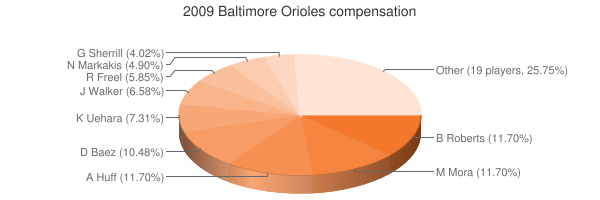
 Aubrey Huff
 |
Huff Aubrey |
1B |
$8,000,000 |
8000000 |
11.70% |
11.70 |
-0.87 |
-0.871687 |
— |
0 |
— |
0 |
|
 Melvin Mora
 |
Mora Melvin |
3B |
$8,000,000 |
8000000 |
11.70% |
11.70 |
0.67 |
0.667141 |
0.08 |
0.083392625 |
$11,991,468 |
11991468.070468 |
|
 Brian Roberts
 |
Roberts Brian |
2B |
$8,000,000 |
8000000 |
11.70% |
11.70 |
1.99 |
1.9899 |
0.25 |
0.2487375 |
$4,020,303 |
4020302.5277652 |
|
 Danys Baez
 |
Baez Danys |
RP |
$7,166,667 |
7166667 |
10.48% |
10.48 |
-0.28 |
-0.283934 |
— |
0 |
— |
0 |
|
 Koji Uehara
 |
Uehara Koji |
RP |
$5,000,000 |
5000000 |
7.31% |
7.31 |
1.26 |
1.25773 |
0.25 |
0.251546 |
$3,975,416 |
3975416.0272873 |
|
 Jamie Walker
 |
Walker Jamie |
RP |
$4,500,000 |
4500000 |
6.58% |
6.58 |
0.30 |
0.297651 |
0.07 |
0.066144666666667 |
$15,118,377 |
15118376.891057 |
|
 Ryan Freel
 |
Freel Ryan |
LF |
$4,000,000 |
4000000 |
5.85% |
5.85 |
-0.02 |
-0.0203368 |
— |
0 |
— |
0 |
|
 Nick Markakis
 |
Markakis Nick |
RF |
$3,350,000 |
3350000 |
4.90% |
4.90 |
0.94 |
0.94188 |
0.28 |
0.28115820895522 |
$3,556,716 |
3556716.354525 |
|
 George Sherrill
 |
Sherrill George |
RP |
$2,750,000 |
2750000 |
4.02% |
4.02 |
0.53 |
0.528816 |
0.19 |
0.19229672727273 |
$5,200,297 |
5200296.511452 |
|
 Ty Wigginton
 |
Wigginton Ty |
1B |
$2,500,000 |
2500000 |
3.66% |
3.66 |
-1.50 |
-1.49732 |
— |
0 |
— |
0 |
|
 Cesar Izturis
 |
Izturis Cesar |
SS |
$2,400,000 |
2400000 |
3.51% |
3.51 |
-0.07 |
-0.0695577 |
— |
0 |
— |
0 |
|
 Luke Scott
 |
Scott Luke |
DH |
$2,400,000 |
2400000 |
3.51% |
3.51 |
1.37 |
1.37137 |
0.57 |
0.57140416666667 |
$1,750,075 |
1750074.7427755 |
|
 Mark Hendrickson
 |
Hendrickson Mark |
RP |
$1,500,000 |
1500000 |
2.19% |
2.19 |
-0.33 |
-0.329129 |
— |
0 |
— |
0 |
|
 Gregg Zaun
 |
Zaun Gregg |
C |
$1,500,000 |
1500000 |
2.19% |
2.19 |
2.37 |
2.37396 |
1.58 |
1.58264 |
$631,856 |
631855.63362483 |
|
 Brian Matusz
 |
Matusz Brian |
RP |
$868,125 |
868125 |
1.27% |
1.27 |
0.18 |
0.182015 |
0.21 |
0.20966450683945 |
$4,769,524 |
4769524.4897399 |
|
 Chris Ray
 |
Ray Chris |
RP |
$850,000 |
850000 |
1.24% |
1.24 |
-0.57 |
-0.57127 |
— |
0 |
— |
0 |
|
 Chad Moeller
 |
Moeller Chad |
C |
$800,000 |
800000 |
1.17% |
1.17 |
0.09 |
0.0885144 |
0.11 |
0.110643 |
$9,038,077 |
9038077.4201712 |
|
 Jeremy Guthrie
 |
Guthrie Jeremy |
RP |
$650,000 |
650000 |
0.95% |
0.95 |
-2.32 |
-2.32106 |
— |
0 |
— |
0 |
|
 Rich Hill
 |
Hill Rich |
RP |
$445,000 |
445000 |
0.65% |
0.65 |
-0.82 |
-0.818742 |
— |
0 |
— |
0 |
|
 Adam Jones
 |
Jones Adam |
CF |
$435,000 |
435000 |
0.64% |
0.64 |
3.88 |
3.88097 |
8.92 |
8.9217701149425 |
$112,085 |
112085.38071668 |
|
 Jim Johnson
 |
Johnson Jim |
RP |
$420,000 |
420000 |
0.61% |
0.61 |
-0.20 |
-0.196393 |
— |
0 |
— |
0 |
|
 Felix Pie
 |
Pie Felix |
LF |
$410,000 |
410000 |
0.60% |
0.60 |
1.46 |
1.46418 |
3.57 |
3.5711707317073 |
$280,020 |
280020.21609365 |
|
 Dennis Sarfate
 |
Sarfate Dennis |
RP |
$410,000 |
410000 |
0.60% |
0.60 |
-0.12 |
-0.115661 |
— |
0 |
— |
0 |
Arb1/2011, Arb2/2012, Arb3/2013, FA/2014 |
 Matt Albers
 |
Albers Matt |
RP |
$410,000 |
410000 |
0.60% |
0.60 |
-1.05 |
-1.04816 |
— |
0 |
— |
0 |
|
 Brian Bass
 |
Bass Brian |
RP |
$405,000 |
405000 |
0.59% |
0.59 |
-1.57 |
-1.5732 |
— |
0 |
— |
0 |
|
 Alfredo Simon
 |
Simon Alfredo |
RP |
$400,000 |
400000 |
0.59% |
0.59 |
-0.17 |
-0.166363 |
— |
0 |
— |
0 |
|
 Robert Andino
 |
Andino Robert |
SS |
$400,000 |
400000 |
0.59% |
0.59 |
0.05 |
0.0506093 |
0.13 |
0.12652325 |
$7,903,686 |
7903685.6862276 |
|
 Michael Aubrey
 |
Aubrey Michael |
1B |
$400,000 |
400000 |
0.59% |
0.59 |
0.54 |
0.541405 |
1.35 |
1.3535125 |
$738,818 |
738818.44460247 |
|
| Year | Orioles payroll |
PR Sort |
Avg payroll |
AvgPR Sort |
Diff |
Diff Sort |
|---|
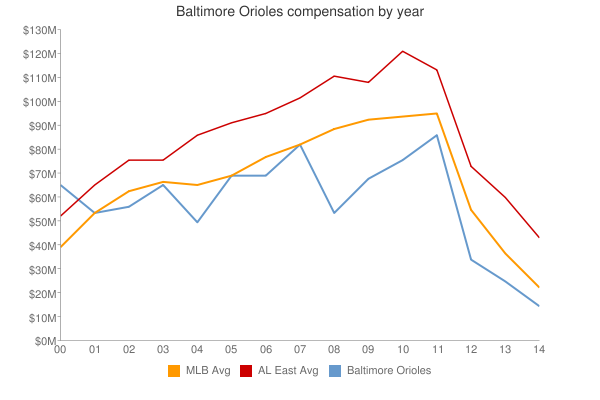
| 2000 | $82,250,111 | 82250111 | $56,164,089 | 56164089 | $26,086,022 | 26086022 |
| 2001 | $73,894,540 | 73894540 | $65,991,638 | 65991638 | $7,902,902 | 7902902 |
| 2002 | $60,496,987 | 60496987 | $68,244,471 | 68244471 | $-7,747,484 | -7747484 |
| 2003 | $73,282,500 | 73282500 | $71,318,479 | 71318479 | $1,964,021 | 1964021 |
| 2004 | $53,273,333 | 53273333 | $70,466,961 | 70466961 | $-17,193,628 | -17193628 |
| 2005 | $73,066,833 | 73066833 | $73,264,780 | 73264780 | $-197,947 | -197947 |
| 2006 | $83,729,266 | 83729266 | $79,051,754 | 79051754 | $4,677,512 | 4677512 |
| 2007 | $94,056,726 | 94056726 | $83,931,138 | 83931138 | $10,125,588 | 10125588 |
| 2008 | $66,644,581 | 66644581 | $90,812,373 | 90812373 | $-24,167,792 | -24167792 |
| 2009 | $68,369,792 | 68369792 | $91,093,211 | 91093211 | $-22,723,419 | -22723419 |
| 2010 | $75,412,500 | 75412500 | $93,373,681 | 93373681 | $-17,961,181 | -17961181 |
| 2011 | $88,184,250 | 88184250 | $96,102,034 | 96102034 | $-7,917,784 | -7917784 |
| 2012 | $84,769,000 | 84769000 | $100,657,138 | 100657138 | $-15,888,138 | -15888138 |
| 2013 | $92,238,334 | 92238334 | $109,024,990 | 109024990 | $-16,786,656 | -16786656 |
| 2014 | $107,976,154 | 107976154 | $117,828,782 | 117828782 | $-9,852,628 | -9852628 |
| 2015 | $118,975,833 | 118975833 | $127,404,244 | 127404244 | $-8,428,411 | -8428411 |
| 2016 | $147,693,714 | 147693714 | $132,219,407 | 132219407 | $15,474,307 | 15474307 |
| 2017 | $164,326,172 | 164326172 | $137,302,894 | 137302894 | $27,023,278 | 27023278 |
| 2018 | $148,574,615 | 148574615 | $136,929,168 | 136929168 | $11,645,447 | 11645447 |
| 2019 | $80,814,882 | 80814882 | $136,944,257 | 136944257 | $-56,129,375 | -56129375 |
| 2020 | $62,285,088 | 62285088 | $140,677,788 | 140677788 | $-78,392,700 | -78392700 |
| 2021 | $62,525,283 | 62525283 | $132,162,631 | 132162631 | $-69,637,348 | -69637348 |
| 2022 | $43,068,167 | 43068167 | $149,374,046 | 149374046 | $-106,305,879 | -106305879 |
| 2023 | $66,889,067 | 66889067 | $160,460,390 | 160460390 | $-93,571,323 | -93571323 |
| 2024 | $52,645,666 | 52645666 | $135,504,022 | 135504022 | $-82,858,356 | -82858356 |
| 2025 | $2,000,000 | 2000000 | $96,417,302 | 96417302 | $-94,417,302 | -94417302 |
|
 2009 Baltimore Orioles