| Player | Player Sort | Pos | Salary | Salary Sort | Pct | Pct Sort | WARP | WARP Sort | WARP/$M | WARP/$M Sort | $/WARP | $/WARP Sort | Current Status |
|---|
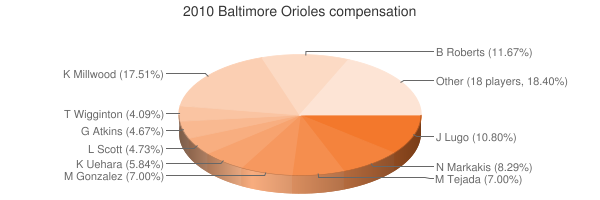
 Kevin Millwood
 |
Millwood Kevin |
RP |
$15,000,000 |
15000000 |
19.89% |
19.89 |
-0.61 |
-0.611296 |
— |
0 |
— |
0 |
|
 Brian Roberts
 |
Roberts Brian |
2B |
$10,000,000 |
10000000 |
13.26% |
13.26 |
0.10 |
0.102198 |
0.01 |
0.0102198 |
$97,849,273 |
97849272.979902 |
|
 Nick Markakis
 |
Markakis Nick |
RF |
$7,100,000 |
7100000 |
9.41% |
9.41 |
1.68 |
1.68449 |
0.24 |
0.23725211267606 |
$4,214,926 |
4214925.5857856 |
|
 Miguel Tejada
 |
Tejada Miguel |
3B |
$6,000,000 |
6000000 |
7.96% |
7.96 |
-0.03 |
-0.0335534 |
— |
0 |
— |
0 |
|
 Michael Gonzalez
 |
Gonzalez Michael |
RP |
$6,000,000 |
6000000 |
7.96% |
7.96 |
0.17 |
0.174683 |
0.03 |
0.029113833333333 |
$34,347,933 |
34347933.113125 |
|
 Koji Uehara
 |
Uehara Koji |
RP |
$5,000,000 |
5000000 |
6.63% |
6.63 |
1.20 |
1.20377 |
0.24 |
0.240754 |
$4,153,617 |
4153617.3853809 |
|
 Luke Scott
 |
Scott Luke |
DH |
$4,050,000 |
4050000 |
5.37% |
5.37 |
1.99 |
1.994 |
0.49 |
0.49234567901235 |
$2,031,093 |
2031093.2798395 |
|
 Garrett Atkins
 |
Atkins Garrett |
1B |
$4,000,000 |
4000000 |
5.30% |
5.30 |
-1.19 |
-1.19449 |
— |
0 |
— |
0 |
|
 Ty Wigginton
 |
Wigginton Ty |
1B |
$3,500,000 |
3500000 |
4.64% |
4.64 |
0.49 |
0.490248 |
0.14 |
0.14007085714286 |
$7,139,244 |
7139243.8112955 |
|
 Jeremy Guthrie
 |
Guthrie Jeremy |
RP |
$3,000,000 |
3000000 |
3.98% |
3.98 |
0.57 |
0.566566 |
0.19 |
0.18885533333333 |
$5,295,058 |
5295058.2985919 |
|
 Cesar Izturis
 |
Izturis Cesar |
SS |
$2,600,000 |
2600000 |
3.45% |
3.45 |
-1.63 |
-1.62903 |
— |
0 |
— |
0 |
|
 Will Ohman
 |
Ohman Will |
RP |
$1,350,000 |
1350000 |
1.79% |
1.79 |
0.20 |
0.20293 |
0.15 |
0.15031851851852 |
$6,652,540 |
6652540.2848273 |
|
 Brian Matusz
 |
Matusz Brian |
RP |
$1,300,000 |
1300000 |
1.72% |
1.72 |
1.22 |
1.21616 |
0.94 |
0.93550769230769 |
$1,068,938 |
1068938.2975924 |
|
 Mark Hendrickson
 |
Hendrickson Mark |
RP |
$1,200,000 |
1200000 |
1.59% |
1.59 |
-0.22 |
-0.217658 |
— |
0 |
— |
0 |
|
 Cla Meredith
 |
Meredith Cla |
RP |
$850,000 |
850000 |
1.13% |
1.13 |
-0.30 |
-0.301574 |
— |
0 |
— |
0 |
|
 Matt Albers
 |
Albers Matt |
RP |
$680,000 |
680000 |
0.90% |
0.90 |
-0.37 |
-0.367263 |
— |
0 |
— |
0 |
|
 Adam Jones
 |
Jones Adam |
CF |
$465,000 |
465000 |
0.62% |
0.62 |
3.93 |
3.92617 |
8.44 |
8.443376344086 |
$118,436 |
118436.03308058 |
|
 Jim Johnson
 |
Johnson Jim |
RP |
$440,000 |
440000 |
0.58% |
0.58 |
0.30 |
0.299062 |
0.68 |
0.67968636363636 |
$1,471,267 |
1471266.8276143 |
|
 Felix Pie
 |
Pie Felix |
LF |
$420,000 |
420000 |
0.56% |
0.56 |
1.66 |
1.65848 |
3.95 |
3.9487619047619 |
$253,244 |
253243.93420481 |
|
 Brad Bergesen
 |
Bergesen Brad |
RP |
$405,000 |
405000 |
0.54% |
0.54 |
-2.12 |
-2.12479 |
— |
0 |
— |
0 |
|
 David Hernandez
 |
Hernandez David |
RP |
$402,500 |
402500 |
0.53% |
0.53 |
-0.30 |
-0.301607 |
— |
0 |
— |
0 |
|
 Nolan Reimold
 |
Reimold Nolan |
LF |
$400,000 |
400000 |
0.53% |
0.53 |
-0.49 |
-0.488957 |
— |
0 |
— |
0 |
|
 Jason Berken
 |
Berken Jason |
RP |
$400,000 |
400000 |
0.53% |
0.53 |
0.95 |
0.952635 |
2.38 |
2.3815875 |
$419,888 |
419887.99487737 |
|
 Craig Tatum
 |
Tatum Craig |
C |
$400,000 |
400000 |
0.53% |
0.53 |
0.64 |
0.641644 |
1.60 |
1.60411 |
$623,399 |
623398.64473135 |
|
 Matt Wieters
 |
Wieters Matt |
C |
$400,000 |
400000 |
0.53% |
0.53 |
2.82 |
2.81706 |
7.04 |
7.04265 |
$141,992 |
141992.00585007 |
|
 Chad Moeller
 |
Moeller Chad |
DNP |
$50,000 |
50000 |
0.07% |
0.07 |
— |
0.00 |
— |
0 |
— |
0 |
|
| Year | Orioles payroll |
PR Sort |
Avg payroll |
AvgPR Sort |
Diff |
Diff Sort |
|---|
| 2000 | $82,250,111 | 82250111 | $56,164,089 | 56164089 | $26,086,022 | 26086022 |
| 2001 | $73,894,540 | 73894540 | $65,991,638 | 65991638 | $7,902,902 | 7902902 |
| 2002 | $60,496,987 | 60496987 | $68,244,471 | 68244471 | $-7,747,484 | -7747484 |
| 2003 | $73,282,500 | 73282500 | $71,318,479 | 71318479 | $1,964,021 | 1964021 |
| 2004 | $53,273,333 | 53273333 | $70,466,961 | 70466961 | $-17,193,628 | -17193628 |
| 2005 | $73,066,833 | 73066833 | $73,264,780 | 73264780 | $-197,947 | -197947 |
| 2006 | $83,729,266 | 83729266 | $79,051,754 | 79051754 | $4,677,512 | 4677512 |
| 2007 | $94,056,726 | 94056726 | $83,931,138 | 83931138 | $10,125,588 | 10125588 |
| 2008 | $66,644,581 | 66644581 | $90,812,373 | 90812373 | $-24,167,792 | -24167792 |
| 2009 | $68,369,792 | 68369792 | $91,093,211 | 91093211 | $-22,723,419 | -22723419 |
| 2010 | $75,412,500 | 75412500 | $93,373,681 | 93373681 | $-17,961,181 | -17961181 |
| 2011 | $88,184,250 | 88184250 | $96,102,034 | 96102034 | $-7,917,784 | -7917784 |
| 2012 | $84,769,000 | 84769000 | $100,657,138 | 100657138 | $-15,888,138 | -15888138 |
| 2013 | $92,238,334 | 92238334 | $109,024,990 | 109024990 | $-16,786,656 | -16786656 |
| 2014 | $107,976,154 | 107976154 | $117,828,782 | 117828782 | $-9,852,628 | -9852628 |
| 2015 | $118,975,833 | 118975833 | $127,404,244 | 127404244 | $-8,428,411 | -8428411 |
| 2016 | $147,693,714 | 147693714 | $132,219,407 | 132219407 | $15,474,307 | 15474307 |
| 2017 | $164,326,172 | 164326172 | $137,302,894 | 137302894 | $27,023,278 | 27023278 |
| 2018 | $148,574,615 | 148574615 | $136,929,168 | 136929168 | $11,645,447 | 11645447 |
| 2019 | $80,814,882 | 80814882 | $136,944,257 | 136944257 | $-56,129,375 | -56129375 |
| 2020 | $62,285,088 | 62285088 | $140,677,788 | 140677788 | $-78,392,700 | -78392700 |
| 2021 | $62,525,283 | 62525283 | $132,162,631 | 132162631 | $-69,637,348 | -69637348 |
| 2022 | $43,068,167 | 43068167 | $149,374,046 | 149374046 | $-106,305,879 | -106305879 |
| 2023 | $66,889,067 | 66889067 | $160,460,390 | 160460390 | $-93,571,323 | -93571323 |
| 2024 | $52,645,666 | 52645666 | $135,504,022 | 135504022 | $-82,858,356 | -82858356 |
| 2025 | $2,000,000 | 2000000 | $96,417,302 | 96417302 | $-94,417,302 | -94417302 |
|
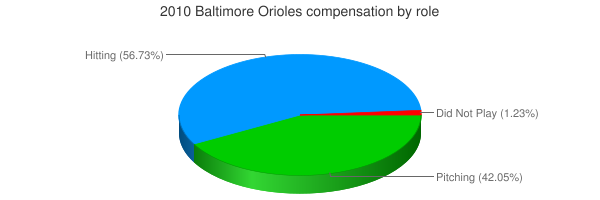
 2010 Baltimore Orioles