| Player | Player Sort | Pos | Salary | Salary Sort | Pct | Pct Sort | WARP | WARP Sort | WARP/$M | WARP/$M Sort | $/WARP | $/WARP Sort | Current Status |
|---|
 Nick Markakis
 |
Markakis Nick |
RF |
$15,350,000 |
15350000 |
16.64% |
16.64 |
1.26 |
1.2554 |
0.08 |
0.081785016286645 |
$12,227,179 |
12227178.588498 |
|
 Brian Roberts
 |
Roberts Brian |
2B |
$10,000,000 |
10000000 |
10.84% |
10.84 |
1.10 |
1.10227 |
0.11 |
0.110227 |
$9,072,187 |
9072187.3951028 |
|
 Adam Jones
 |
Jones Adam |
CF |
$8,833,334 |
8833334 |
9.58% |
9.58 |
3.10 |
3.1044 |
0.35 |
0.35144148291008 |
$2,845,424 |
2845423.914444 |
|
 J.J. Hardy
 |
Hardy J.J. |
SS |
$7,416,667 |
7416667 |
8.04% |
8.04 |
1.50 |
1.49542 |
0.20 |
0.20162965385934 |
$4,959,588 |
4959587.9418491 |
|
 Jason Hammel
 |
Hammel Jason |
RP |
$6,750,000 |
6750000 |
7.32% |
7.32 |
-2.53 |
-2.52787 |
— |
0 |
— |
0 |
|
 Jim Johnson
 |
Johnson Jim |
RP |
$6,500,000 |
6500000 |
7.05% |
7.05 |
-0.32 |
-0.317431 |
— |
0 |
— |
0 |
|
 Matt Wieters
 |
Wieters Matt |
C |
$5,500,000 |
5500000 |
5.96% |
5.96 |
2.73 |
2.7289 |
0.50 |
0.49616363636364 |
$2,015,464 |
2015464.1064165 |
|
 Tsuyoshi Wada
 |
Wada Tsuyoshi |
DNP |
$4,200,000 |
4200000 |
4.55% |
4.55 |
— |
0.00 |
— |
0 |
— |
0 |
|
 Wei-Yin Chen
 |
Chen Wei-Yin |
RP |
$3,655,333 |
3655333 |
3.96% |
3.96 |
-0.46 |
-0.458605 |
— |
0 |
— |
0 |
|
 Chris Davis
 |
Davis Chris |
1B |
$3,300,000 |
3300000 |
3.58% |
3.58 |
7.01 |
7.01026 |
2.12 |
2.1243212121212 |
$470,739 |
470738.60313312 |
|
 Darren O'Day
 |
O'Day Darren |
RP |
$2,200,000 |
2200000 |
2.39% |
2.39 |
0.91 |
0.914828 |
0.42 |
0.41583090909091 |
$2,404,824 |
2404823.6389791 |
|
 Nate McLouth
 |
McLouth Nate |
LF |
$2,000,000 |
2000000 |
2.17% |
2.17 |
2.37 |
2.37448 |
1.19 |
1.18724 |
$842,290 |
842289.68026684 |
|
 Wilson Betemit
 |
Betemit Wilson |
DH |
$2,000,000 |
2000000 |
2.17% |
2.17 |
-0.29 |
-0.289869 |
— |
0 |
— |
0 |
|
 Tommy Hunter
 |
Hunter Tommy |
RP |
$1,820,000 |
1820000 |
1.97% |
1.97 |
0.91 |
0.90562 |
0.50 |
0.49759340659341 |
$2,009,673 |
2009672.9312515 |
|
 Alexi Casilla
 |
Casilla Alexi |
2B |
$1,700,000 |
1700000 |
1.84% |
1.84 |
-0.22 |
-0.218247 |
— |
0 |
— |
0 |
|
 Brian Matusz
 |
Matusz Brian |
RP |
$1,600,000 |
1600000 |
1.73% |
1.73 |
0.70 |
0.697007 |
0.44 |
0.435629375 |
$2,295,529 |
2295529.313192 |
|
 Dylan Bundy
 |
Bundy Dylan |
DNP |
$1,245,000 |
1245000 |
1.35% |
1.35 |
— |
0.00 |
— |
0 |
— |
0 |
|
 Nolan Reimold
 |
Reimold Nolan |
DH |
$1,000,000 |
1000000 |
1.08% |
1.08 |
0.00 |
0.00443606 |
0.00 |
0.00443606 |
$225,425,265 |
225425264.76197 |
|
 Luis Ayala
 |
Ayala Luis |
RP |
$1,000,000 |
1000000 |
1.08% |
1.08 |
0.01 |
0.00660675 |
0.01 |
0.00660675 |
$151,360,351 |
151360351.15601 |
|
 Troy Patton
 |
Patton Troy |
RP |
$815,000 |
815000 |
0.88% |
0.88 |
0.49 |
0.493539 |
0.61 |
0.60556932515337 |
$1,651,339 |
1651338.597355 |
|
 Steve Pearce
 |
Pearce Steve |
DH |
$700,000 |
700000 |
0.76% |
0.76 |
0.67 |
0.66741 |
0.95 |
0.95344285714286 |
$1,048,831 |
1048830.5539324 |
|
 Taylor Teagarden
 |
Teagarden Taylor |
C |
$650,000 |
650000 |
0.70% |
0.70 |
-0.43 |
-0.43086 |
— |
0 |
— |
0 |
|
 Jake Arrieta
 |
Arrieta Jake |
RP |
$516,500 |
516500 |
0.56% |
0.56 |
-0.68 |
-0.682363 |
— |
0 |
— |
0 |
|
 Chris Tillman
 |
Tillman Chris |
RP |
$508,500 |
508500 |
0.55% |
0.55 |
0.43 |
0.432304 |
0.85 |
0.85015535889872 |
$1,176,256 |
1176255.5979126 |
|
 Pedro Strop
 |
Strop Pedro |
RP |
$502,500 |
502500 |
0.54% |
0.54 |
-0.04 |
-0.0415909 |
— |
0 |
— |
0 |
|
 Miguel González
 |
Gonzalez Miguel |
RP |
$502,000 |
502000 |
0.54% |
0.54 |
-0.59 |
-0.594951 |
— |
0 |
— |
0 |
|
 Steve Johnson
 |
Johnson Steve |
RP |
$495,000 |
495000 |
0.54% |
0.54 |
-0.03 |
-0.0272188 |
— |
0 |
— |
0 |
|
 Manny Machado
 |
Machado Manny |
3B |
$495,000 |
495000 |
0.54% |
0.54 |
5.98 |
5.98208 |
12.09 |
12.08501010101 |
$82,747 |
82747.138119183 |
|
 Ryan Flaherty
 |
Flaherty Ryan |
2B |
$493,500 |
493500 |
0.54% |
0.54 |
0.11 |
0.107613 |
0.22 |
0.21806079027356 |
$4,585,877 |
4585877.1709738 |
|
 T.J. McFarland
 |
McFarland T.J. |
RP |
$490,000 |
490000 |
0.53% |
0.53 |
-0.53 |
-0.528701 |
— |
0 |
— |
0 |
|
| Year | Orioles payroll |
PR Sort |
Avg payroll |
AvgPR Sort |
Diff |
Diff Sort |
|---|
| 2000 | $82,250,111 | 82250111 | $57,491,092 | 57491092 | $24,759,019 | 24759019 |
| 2001 | $73,894,540 | 73894540 | $67,120,750 | 67120750 | $6,773,790 | 6773790 |
| 2002 | $60,496,987 | 60496987 | $69,204,705 | 69204705 | $-8,707,718 | -8707718 |
| 2003 | $73,282,500 | 73282500 | $72,156,639 | 72156639 | $1,125,861 | 1125861 |
| 2004 | $53,273,333 | 53273333 | $71,426,357 | 71426357 | $-18,153,024 | -18153024 |
| 2005 | $73,066,833 | 73066833 | $73,628,169 | 73628169 | $-561,336 | -561336 |
| 2006 | $83,729,266 | 83729266 | $81,192,832 | 81192832 | $2,536,434 | 2536434 |
| 2007 | $94,056,726 | 94056726 | $85,747,487 | 85747487 | $8,309,239 | 8309239 |
| 2008 | $66,644,581 | 66644581 | $93,079,041 | 93079041 | $-26,434,460 | -26434460 |
| 2009 | $68,369,792 | 68369792 | $92,957,049 | 92957049 | $-24,587,257 | -24587257 |
| 2010 | $75,412,500 | 75412500 | $94,957,956 | 94957956 | $-19,545,456 | -19545456 |
| 2011 | $88,184,250 | 88184250 | $97,426,414 | 97426414 | $-9,242,164 | -9242164 |
| 2012 | $84,769,000 | 84769000 | $100,689,500 | 100689500 | $-15,920,500 | -15920500 |
| 2013 | $92,238,334 | 92238334 | $106,658,387 | 106658387 | $-14,420,053 | -14420053 |
| 2014 | $107,976,154 | 107976154 | $115,428,670 | 115428670 | $-7,452,516 | -7452516 |
| 2015 | $118,975,833 | 118975833 | $125,458,486 | 125458486 | $-6,482,653 | -6482653 |
| 2016 | $147,693,714 | 147693714 | $130,290,910 | 130290910 | $17,402,804 | 17402804 |
| 2017 | $164,326,172 | 164326172 | $136,573,000 | 136573000 | $27,753,172 | 27753172 |
| 2018 | $148,574,615 | 148574615 | $135,681,867 | 135681867 | $12,892,748 | 12892748 |
| 2019 | $80,814,882 | 80814882 | $134,776,225 | 134776225 | $-53,961,343 | -53961343 |
| 2020 | $62,285,088 | 62285088 | $138,321,485 | 138321485 | $-76,036,397 | -76036397 |
| 2021 | $62,525,283 | 62525283 | $129,635,938 | 129635938 | $-67,110,655 | -67110655 |
| 2022 | $43,068,167 | 43068167 | $147,002,411 | 147002411 | $-103,934,244 | -103934244 |
| 2023 | $66,889,067 | 66889067 | $158,155,877 | 158155877 | $-91,266,810 | -91266810 |
| 2024 | $52,645,666 | 52645666 | $133,074,721 | 133074721 | $-80,429,055 | -80429055 |
| 2025 | $2,000,000 | 2000000 | $94,180,059 | 94180059 | $-92,180,059 | -92180059 |
|
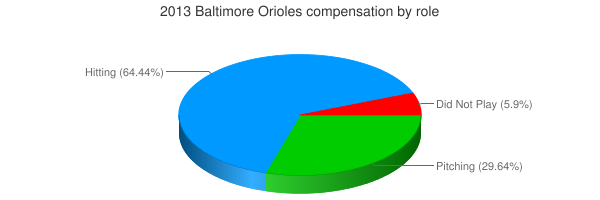
 2013 Baltimore Orioles