| Player | Player Sort | Pos | Salary | Salary Sort | Pct | Pct Sort | WARP | WARP Sort | WARP/$M | WARP/$M Sort | $/WARP | $/WARP Sort | Current Status |
|---|
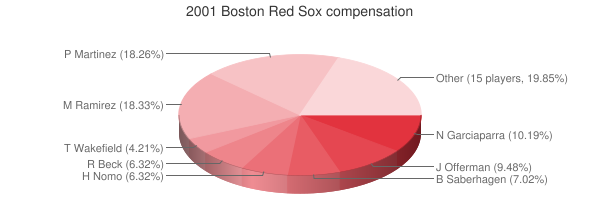
 Manny Ramirez
 |
Ramirez Manny |
DH |
$15,000,000 |
15000000 |
13.45% |
13.45 |
5.76 |
5.76158 |
0.38 |
0.38410533333333 |
$2,603,453 |
2603452.5251754 |
|
 Pedro Martinez
 |
Martinez Pedro |
RP |
$13,000,000 |
13000000 |
11.66% |
11.66 |
5.12 |
5.11949 |
0.39 |
0.39380692307692 |
$2,539,315 |
2539315.4396239 |
|
 Carl Everett
 |
Everett Carl |
CF |
$7,333,333 |
7333333 |
6.58% |
6.58 |
1.17 |
1.16538 |
0.16 |
0.15891546176888 |
$6,292,654 |
6292653.8982993 |
|
 Nomar Garciaparra
 |
Garciaparra Nomar |
SS |
$7,250,000 |
7250000 |
6.50% |
6.50 |
0.76 |
0.7647 |
0.11 |
0.10547586206897 |
$9,480,842 |
9480842.1603243 |
|
 Dante Bichette
 |
Bichette Dante |
DH |
$7,000,000 |
7000000 |
6.28% |
6.28 |
0.78 |
0.776474 |
0.11 |
0.11092485714286 |
$9,015,112 |
9015111.9032962 |
|
 Jose Offerman
 |
Offerman Jose |
2B |
$6,750,000 |
6750000 |
6.05% |
6.05 |
1.57 |
1.5743 |
0.23 |
0.23322962962963 |
$4,287,620 |
4287619.8945563 |
|
 John Valentin
 |
Valentin John |
SS |
$6,350,000 |
6350000 |
5.70% |
5.70 |
-0.03 |
-0.0320378 |
— |
0 |
— |
0 |
|
 Mike Lansing
 |
Lansing Mike |
SS |
$6,250,000 |
6250000 |
5.61% |
5.61 |
0.04 |
0.0369365 |
0.01 |
0.00590984 |
$169,209,319 |
169209318.6956 |
|
 Troy O'Leary
 |
O'Leary Troy |
LF |
$4,600,000 |
4600000 |
4.13% |
4.13 |
-0.08 |
-0.0791209 |
— |
0 |
— |
0 |
|
 Rod Beck
 |
Beck Rod |
RP |
$4,500,000 |
4500000 |
4.04% |
4.04 |
0.85 |
0.852745 |
0.19 |
0.18949888888889 |
$5,277,076 |
5277075.7963987 |
|
 Bret Saberhagen
 |
Saberhagen Bret |
RP |
$4,500,000 |
4500000 |
4.04% |
4.04 |
0.10 |
0.103632 |
0.02 |
0.023029333333333 |
$43,422,881 |
43422880.963409 |
|
 Hideo Nomo
 |
Nomo Hideo |
RP |
$4,500,000 |
4500000 |
4.04% |
4.04 |
5.23 |
5.23007 |
1.16 |
1.1622377777778 |
$860,409 |
860409.13410337 |
|
 Tim Wakefield
 |
Wakefield Tim |
RP |
$3,000,000 |
3000000 |
2.69% |
2.69 |
3.70 |
3.70366 |
1.23 |
1.2345533333333 |
$810,010 |
810009.55811279 |
|
 Darren Lewis
 |
Lewis Darren |
RF |
$2,500,000 |
2500000 |
2.24% |
2.24 |
0.08 |
0.0758547 |
0.03 |
0.03034188 |
$32,957,747 |
32957746.850228 |
|
 Frank Castillo
 |
Castillo Frank |
RP |
$2,250,000 |
2250000 |
2.02% |
2.02 |
2.25 |
2.24873 |
1.00 |
0.99943555555556 |
$1,000,565 |
1000564.7632219 |
|
 Derek Lowe
 |
Lowe Derek |
RP |
$2,125,000 |
2125000 |
1.91% |
1.91 |
2.41 |
2.40594 |
1.13 |
1.1322070588235 |
$883,231 |
883230.67075654 |
|
 Jason Varitek
 |
Varitek Jason |
C |
$1,800,000 |
1800000 |
1.61% |
1.61 |
1.23 |
1.22579 |
0.68 |
0.68099444444444 |
$1,468,441 |
1468440.7606523 |
|
 Rolando Arrojo
 |
Arrojo Rolando |
RP |
$1,625,000 |
1625000 |
1.46% |
1.46 |
1.57 |
1.56699 |
0.96 |
0.96430153846154 |
$1,037,020 |
1037020.0192726 |
|
 Bryce Florie
 |
Florie Bryce |
RP |
$1,450,000 |
1450000 |
1.30% |
1.30 |
-0.13 |
-0.13089 |
— |
0 |
— |
0 |
|
 Rich Garces
 |
Garces Rich |
RP |
$1,375,000 |
1375000 |
1.23% |
1.23 |
0.93 |
0.934291 |
0.68 |
0.67948436363636 |
$1,471,704 |
1471704.212071 |
|
 Chris Stynes
 |
Stynes Chris |
3B |
$1,300,000 |
1300000 |
1.17% |
1.17 |
0.10 |
0.100919 |
0.08 |
0.07763 |
$12,881,618 |
12881617.931212 |
|
 Hipolito Pichardo
 |
Pichardo Hipolito |
RP |
$1,300,000 |
1300000 |
1.17% |
1.17 |
-0.30 |
-0.301865 |
— |
0 |
— |
0 |
|
 Scott Hatteberg
 |
Hatteberg Scott |
C |
$1,050,000 |
1050000 |
0.94% |
0.94 |
-0.85 |
-0.848 |
— |
0 |
— |
0 |
|
 David Cone
 |
Cone David |
RP |
$1,000,000 |
1000000 |
0.90% |
0.90 |
1.45 |
1.45003 |
1.45 |
1.45003 |
$689,641 |
689640.9039813 |
|
 Pete Schourek
 |
Schourek Pete |
RP |
$1,000,000 |
1000000 |
0.90% |
0.90 |
-0.29 |
-0.286706 |
— |
0 |
— |
0 |
|
 Craig Grebeck
 |
Grebeck Craig |
SS |
$700,000 |
700000 |
0.63% |
0.63 |
-0.82 |
-0.823364 |
— |
0 |
— |
0 |
|
 Brian Daubach
 |
Daubach Brian |
1B |
$400,000 |
400000 |
0.36% |
0.36 |
2.01 |
2.00732 |
5.02 |
5.0183 |
$199,271 |
199270.66935018 |
|
 Trot Nixon
 |
Nixon Trot |
RF |
$390,000 |
390000 |
0.35% |
0.35 |
4.58 |
4.57734 |
11.74 |
11.736769230769 |
$85,202 |
85202.322746399 |
|
 Doug Mirabelli
 |
Mirabelli Doug |
C |
$295,000 |
295000 |
0.26% |
0.26 |
1.54 |
1.54489 |
5.24 |
5.2369152542373 |
$190,952 |
190952.10662248 |
|
 Abe Alvarez
 |
Alvarez Abe |
DNP |
$270,000 |
270000 |
0.24% |
0.24 |
— |
0.00 |
— |
0 |
— |
0 |
|
 Tomo Ohka
 |
Ohka Tomo |
RP |
$225,000 |
225000 |
0.20% |
0.20 |
-0.11 |
-0.108403 |
— |
0 |
— |
0 |
|
 Shea Hillenbrand
 |
Hillenbrand Shea |
3B |
$200,000 |
200000 |
0.18% |
0.18 |
0.30 |
0.29689 |
1.48 |
1.48445 |
$673,650 |
673650.17346492 |
|
 Paxton Crawford
 |
Crawford Paxton |
RP |
$200,000 |
200000 |
0.18% |
0.18 |
0.38 |
0.383894 |
1.92 |
1.91947 |
$520,977 |
520977.14473266 |
|
| Year | Red Sox payroll |
PR Sort |
Avg payroll |
AvgPR Sort |
Diff |
Diff Sort |
|---|
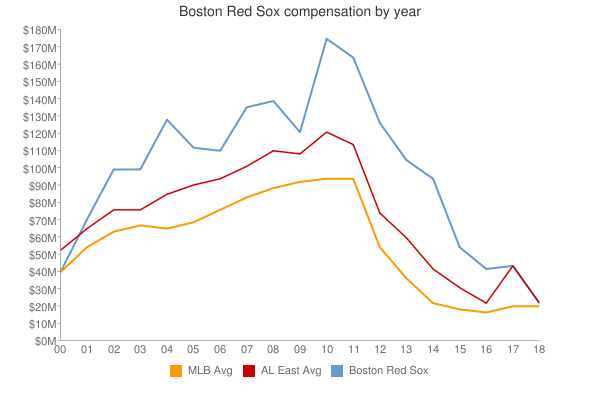
| 1997 | $1,100,000 | 1100000 | $4,753,000 | 4753000 | $-3,653,000 | -3653000 |
| 1998 | $9,100,000 | 9100000 | $6,661,904 | 6661904 | $2,438,096 | 2438096 |
| 1999 | $14,500,000 | 14500000 | $7,867,823 | 7867823 | $6,632,177 | 6632177 |
| 2000 | $80,978,533 | 80978533 | $55,368,142 | 55368142 | $25,610,391 | 25610391 |
| 2001 | $111,488,333 | 111488333 | $64,937,084 | 64937084 | $46,551,249 | 46551249 |
| 2002 | $108,645,000 | 108645000 | $67,238,672 | 67238672 | $41,406,328 | 41406328 |
| 2003 | $99,251,500 | 99251500 | $70,654,480 | 70654480 | $28,597,020 | 28597020 |
| 2004 | $128,545,500 | 128545500 | $69,466,729 | 69466729 | $59,078,771 | 59078771 |
| 2005 | $125,097,825 | 125097825 | $74,114,841 | 74114841 | $50,982,984 | 50982984 |
| 2006 | $124,406,500 | 124406500 | $79,621,815 | 79621815 | $44,784,685 | 44784685 |
| 2007 | $147,568,833 | 147568833 | $85,537,470 | 85537470 | $62,031,363 | 62031363 |
| 2008 | $136,798,083 | 136798083 | $92,003,799 | 92003799 | $44,794,284 | 44794284 |
| 2009 | $122,803,640 | 122803640 | $92,169,598 | 92169598 | $30,634,042 | 30634042 |
| 2010 | $173,759,833 | 173759833 | $94,342,601 | 94342601 | $79,417,232 | 79417232 |
| 2011 | $165,828,976 | 165828976 | $96,974,710 | 96974710 | $68,854,266 | 68854266 |
| 2012 | $175,205,284 | 175205284 | $100,947,217 | 100947217 | $74,258,067 | 74258067 |
| 2013 | $150,655,000 | 150655000 | $108,586,966 | 108586966 | $42,068,034 | 42068034 |
| 2014 | $163,414,996 | 163414996 | $117,131,361 | 117131361 | $46,283,635 | 46283635 |
| 2015 | $180,779,329 | 180779329 | $126,168,161 | 126168161 | $54,611,168 | 54611168 |
| 2016 | $197,899,679 | 197899679 | $131,756,569 | 131756569 | $66,143,110 | 66143110 |
| 2017 | $197,041,179 | 197041179 | $136,337,445 | 136337445 | $60,703,734 | 60703734 |
| 2018 | $233,200,428 | 233200428 | $135,360,600 | 135360600 | $97,839,828 | 97839828 |
| 2019 | $236,171,428 | 236171428 | $134,792,134 | 134792134 | $101,379,294 | 101379294 |
| 2020 | $187,907,969 | 187907969 | $139,496,467 | 139496467 | $48,411,502 | 48411502 |
| 2021 | $176,099,500 | 176099500 | $130,712,288 | 130712288 | $45,387,212 | 45387212 |
| 2022 | $212,015,000 | 212015000 | $149,802,695 | 149802695 | $62,212,305 | 62212305 |
| 2023 | $154,435,000 | 154435000 | $161,692,345 | 161692345 | $-7,257,345 | -7257345 |
| 2024 | $97,266,667 | 97266667 | $136,306,249 | 136306249 | $-39,039,582 | -39039582 |
| 2025 | $86,566,667 | 86566667 | $98,329,527 | 98329527 | $-11,762,860 | -11762860 |
| 2026 | $73,916,667 | 73916667 | $78,039,273 | 78039273 | $-4,122,606 | -4122606 |
| 2027 | $71,416,667 | 71416667 | $60,919,343 | 60919343 | $10,497,324 | 10497324 |
| 2028 | $59,916,667 | 59916667 | $46,901,712 | 46901712 | $13,014,955 | 13014955 |
| 2029 | $59,916,667 | 59916667 | $38,597,944 | 38597944 | $21,318,723 | 21318723 |
| 2030 | $44,750,000 | 44750000 | $41,447,579 | 41447579 | $3,302,421 | 3302421 |
| 2031 | $44,000,000 | 44000000 | $38,360,152 | 38360152 | $5,639,848 | 5639848 |
| 2032 | $35,000,000 | 35000000 | $47,925,459 | 47925459 | $-12,925,459 | -12925459 |
| 2033 | $31,000,000 | 31000000 | $43,068,924 | 43068924 | $-12,068,924 | -12068924 |
|
 2001 Boston Red Sox