| Player | Player Sort | Pos | Salary | Salary Sort | Pct | Pct Sort | WARP | WARP Sort | WARP/$M | WARP/$M Sort | $/WARP | $/WARP Sort | Current Status |
|---|
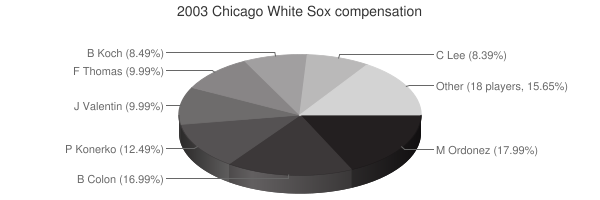
 Magglio Ordonez
 |
Ordonez Magglio |
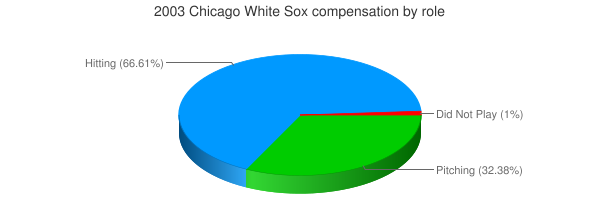
RF |
$9,000,000 |
9000000 |
17.58% |
17.58 |
4.79 |
4.79216 |
0.53 |
0.53246222222222 |
$1,878,068 |
1878067.5102668 |
|
 Bartolo Colon
 |
Colon Bartolo |
RP |
$8,250,000 |
8250000 |
16.12% |
16.12 |
4.20 |
4.19656 |
0.51 |
0.50867393939394 |
$1,965,896 |
1965895.8766228 |
|
 Paul Konerko
 |
Konerko Paul |
1B |
$6,250,000 |
6250000 |
12.21% |
12.21 |
-0.53 |
-0.528052 |
— |
0 |
— |
0 |
|
 Jose Valentin
 |
Valentin Jose |
SS |
$5,000,000 |
5000000 |
9.77% |
9.77 |
3.85 |
3.8511 |
0.77 |
0.77022 |
$1,298,330 |
1298330.3471735 |
|
 Frank Thomas
 |
Thomas Frank |
DH |
$5,000,000 |
5000000 |
9.77% |
9.77 |
3.97 |
3.97271 |
0.79 |
0.794542 |
$1,258,587 |
1258586.7078141 |
|
 Billy Koch
 |
Koch Billy |
RP |
$4,250,000 |
4250000 |
8.30% |
8.30 |
0.17 |
0.171393 |
0.04 |
0.040327764705882 |
$24,796,812 |
24796812.005158 |
|
 Carlos Lee
 |
Lee Carlos |
LF |
$4,200,000 |
4200000 |
8.21% |
8.21 |
3.21 |
3.20601 |
0.76 |
0.76333571428571 |
$1,310,040 |
1310039.5819102 |
|
 Tom Gordon
 |
Gordon Tom |
RP |
$1,400,000 |
1400000 |
2.74% |
2.74 |
2.55 |
2.55099 |
1.82 |
1.8221357142857 |
$548,807 |
548806.54177398 |
|
 Sandy Alomar Jr.
 |
Alomar Sandy |
C |
$700,000 |
700000 |
1.37% |
1.37 |
-0.00 |
-0.00306332 |
— |
0 |
— |
0 |
|
 Tony Graffanino
 |
Graffanino Tony |
SS |
$675,000 |
675000 |
1.32% |
1.32 |
2.18 |
2.18246 |
3.23 |
3.2332740740741 |
$309,284 |
309284.01895109 |
|
 Rick White
 |
White Rick |
RP |
$600,000 |
600000 |
1.17% |
1.17 |
1.00 |
0.999826 |
1.67 |
1.6663766666667 |
$600,104 |
600104.41816876 |
|
 Kelly Wunsch
 |
Wunsch Kelly |
RP |
$575,000 |
575000 |
1.12% |
1.12 |
0.62 |
0.615589 |
1.07 |
1.0705895652174 |
$934,065 |
934064.77373702 |
|
 Esteban Loaiza
 |
Loaiza Esteban |
RP |
$500,000 |
500000 |
0.98% |
0.98 |
7.45 |
7.4473 |
14.89 |
14.8946 |
$67,138 |
67138.426006741 |
|
 Mark Quinn
 |
Quinn Mark |
DNP |
$500,000 |
500000 |
0.98% |
0.98 |
— |
0.00 |
— |
0 |
— |
0 |
|
 Brian Daubach
 |
Daubach Brian |
1B |
$450,000 |
450000 |
0.88% |
0.88 |
-0.11 |
-0.109282 |
— |
0 |
— |
0 |
|
 Armando Rios
 |
Rios Armando |
CF |
$450,000 |
450000 |
0.88% |
0.88 |
-0.84 |
-0.840046 |
— |
0 |
— |
0 |
|
 Mark Buehrle
 |
Buehrle Mark |
RP |
$445,000 |
445000 |
0.87% |
0.87 |
2.11 |
2.10776 |
4.74 |
4.7365393258427 |
$211,125 |
211124.60621703 |
|
 Jon Garland
 |
Garland Jon |
RP |
$375,000 |
375000 |
0.73% |
0.73 |
0.95 |
0.95348 |
2.54 |
2.5426133333333 |
$393,296 |
393296.13625876 |
|
 D'Angelo Jimenez
 |
Jimenez D'Angelo |
2B |
$345,000 |
345000 |
0.67% |
0.67 |
-0.07 |
-0.0740544 |
— |
0 |
— |
0 |
|
 Damaso Marte
 |
Marte Damaso |
RP |
$330,000 |
330000 |
0.64% |
0.64 |
2.34 |
2.33654 |
7.08 |
7.0804242424242 |
$141,234 |
141234.47490734 |
|
 Josh Paul
 |
Paul Josh |
C |
$325,000 |
325000 |
0.64% |
0.64 |
0.20 |
0.195948 |
0.60 |
0.60291692307692 |
$1,658,603 |
1658603.3029171 |
|
 Dan Wright
 |
Wright Dan |
RP |
$325,000 |
325000 |
0.64% |
0.64 |
-1.75 |
-1.74719 |
— |
0 |
— |
0 |
|
 Aaron Rowand
 |
Rowand Aaron |
CF |
$320,000 |
320000 |
0.63% |
0.63 |
0.59 |
0.5912 |
1.85 |
1.8475 |
$541,272 |
541271.98917456 |
|
 Joe Crede
 |
Crede Joe |
3B |
$315,000 |
315000 |
0.62% |
0.62 |
1.42 |
1.41853 |
4.50 |
4.5032698412698 |
$222,061 |
222060.86582589 |
|
 Miguel Olivo
 |
Olivo Miguel |
C |
$300,000 |
300000 |
0.59% |
0.59 |
1.83 |
1.82978 |
6.10 |
6.0992666666667 |
$163,954 |
163954.13656287 |
|
 Josh Stewart
 |
Stewart Josh |
RP |
$300,000 |
300000 |
0.59% |
0.59 |
0.19 |
0.194197 |
0.65 |
0.64732333333333 |
$1,544,823 |
1544823.0405207 |
|
| Year | White Sox payroll |
PR Sort |
Avg payroll |
AvgPR Sort |
Diff |
Diff Sort |
|---|
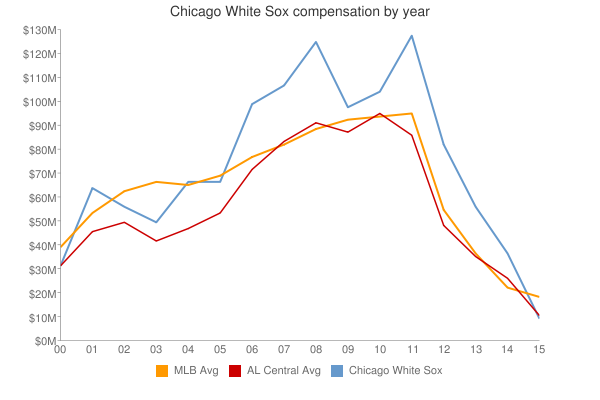
| 2000 | $31,006,000 | 31006000 | $55,368,142 | 55368142 | $-24,362,142 | -24362142 |
| 2001 | $65,906,167 | 65906167 | $64,937,084 | 64937084 | $969,083 | 969083 |
| 2002 | $57,757,833 | 57757833 | $67,238,672 | 67238672 | $-9,480,839 | -9480839 |
| 2003 | $51,180,000 | 51180000 | $70,654,480 | 70654480 | $-19,474,480 | -19474480 |
| 2004 | $67,812,500 | 67812500 | $69,466,729 | 69466729 | $-1,654,229 | -1654229 |
| 2005 | $75,695,000 | 75695000 | $74,114,841 | 74114841 | $1,580,159 | 1580159 |
| 2006 | $102,175,667 | 102175667 | $79,621,815 | 79621815 | $22,553,852 | 22553852 |
| 2007 | $108,956,833 | 108956833 | $85,537,470 | 85537470 | $23,419,363 | 23419363 |
| 2008 | $121,250,167 | 121250167 | $92,003,799 | 92003799 | $29,246,368 | 29246368 |
| 2009 | $98,473,500 | 98473500 | $92,169,598 | 92169598 | $6,303,902 | 6303902 |
| 2010 | $102,780,000 | 102780000 | $94,342,601 | 94342601 | $8,437,399 | 8437399 |
| 2011 | $127,789,000 | 127789000 | $96,974,710 | 96974710 | $30,814,290 | 30814290 |
| 2012 | $97,669,500 | 97669500 | $100,947,217 | 100947217 | $-3,277,717 | -3277717 |
| 2013 | $118,914,500 | 118914500 | $108,586,966 | 108586966 | $10,327,534 | 10327534 |
| 2014 | $90,062,658 | 90062658 | $117,131,361 | 117131361 | $-27,068,703 | -27068703 |
| 2015 | $118,619,177 | 118619177 | $126,168,161 | 126168161 | $-7,548,984 | -7548984 |
| 2016 | $114,498,667 | 114498667 | $131,756,569 | 131756569 | $-17,257,902 | -17257902 |
| 2017 | $97,823,271 | 97823271 | $136,337,445 | 136337445 | $-38,514,174 | -38514174 |
| 2018 | $71,217,000 | 71217000 | $135,360,600 | 135360600 | $-64,143,600 | -64143600 |
| 2019 | $88,902,000 | 88902000 | $134,792,134 | 134792134 | $-45,890,134 | -45890134 |
| 2020 | $124,215,000 | 124215000 | $139,496,467 | 139496467 | $-15,281,467 | -15281467 |
| 2021 | $130,741,666 | 130741666 | $130,712,288 | 130712288 | $29,378 | 29378 |
| 2022 | $192,156,232 | 192156232 | $149,802,695 | 149802695 | $42,353,537 | 42353537 |
| 2023 | $181,938,668 | 181938668 | $161,692,345 | 161692345 | $20,246,323 | 20246323 |
| 2024 | $97,083,334 | 97083334 | $136,306,249 | 136306249 | $-39,222,915 | -39222915 |
| 2025 | $43,090,000 | 43090000 | $98,329,527 | 98329527 | $-55,239,527 | -55239527 |
| 2026 | $19,100,000 | 19100000 | $78,039,273 | 78039273 | $-58,939,273 | -58939273 |
| 2027 | $15,100,000 | 15100000 | $60,919,343 | 60919343 | $-45,819,343 | -45819343 |
|
 2003 Chicago White Sox