| Player | Player Sort | Pos | Salary | Salary Sort | Pct | Pct Sort | WARP | WARP Sort | WARP/$M | WARP/$M Sort | $/WARP | $/WARP Sort | Current Status |
|---|
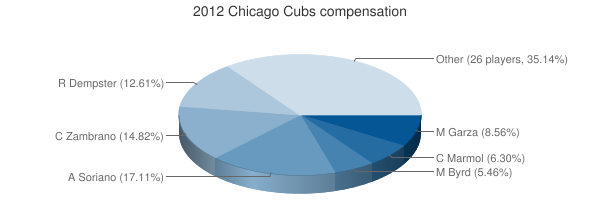
 Alfonso Soriano
 |
Soriano Alfonso |
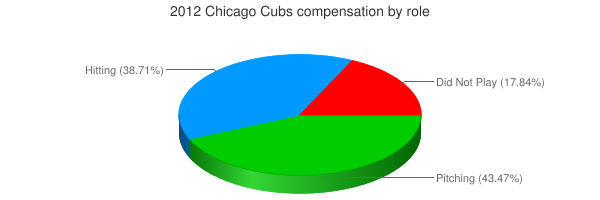
LF |
$19,000,000 |
19000000 |
17.11% |
17.11 |
3.78 |
3.77652 |
0.20 |
0.19876421052632 |
$5,031,087 |
5031086.8206709 |
|
 Carlos Zambrano
 |
Zambrano Carlos |
DNP |
$16,450,000 |
16450000 |
14.82% |
14.82 |
— |
0.00 |
— |
0 |
— |
0 |
|
 Ryan Dempster
 |
Dempster Ryan |
RP |
$14,000,000 |
14000000 |
12.61% |
12.61 |
1.85 |
1.84618 |
0.13 |
0.13187 |
$7,583,226 |
7583225.9042997 |
|
 Matt Garza
 |
Garza Matt |
RP |
$9,500,000 |
9500000 |
8.56% |
8.56 |
2.06 |
2.06026 |
0.22 |
0.21686947368421 |
$4,611,069 |
4611068.5059167 |
|
 Carlos Marmol
 |
Marmol Carlos |
RP |
$7,000,000 |
7000000 |
6.30% |
6.30 |
-0.89 |
-0.889829 |
— |
0 |
— |
0 |
|
 Marlon Byrd
 |
Byrd Marlon |
CF |
$6,064,835 |
6064835 |
5.46% |
5.46 |
-0.47 |
-0.470072 |
— |
0 |
— |
0 |
|
 Geovany Soto
 |
Soto Geovany |
C |
$4,300,000 |
4300000 |
3.87% |
3.87 |
0.99 |
0.986245 |
0.23 |
0.22935930232558 |
$4,359,971 |
4359971.4066991 |
|
 David DeJesus
 |
DeJesus David |
RF |
$4,250,000 |
4250000 |
3.83% |
3.83 |
2.09 |
2.08751 |
0.49 |
0.49117882352941 |
$2,035,918 |
2035918.3908101 |
|
 Paul Maholm
 |
Maholm Paul |
RP |
$4,250,000 |
4250000 |
3.83% |
3.83 |
0.12 |
0.120096 |
0.03 |
0.028257882352941 |
$35,388,356 |
35388355.981881 |
|
 Kerry Wood
 |
Wood Kerry |
RP |
$3,000,000 |
3000000 |
2.70% |
2.70 |
-0.20 |
-0.197268 |
— |
0 |
— |
0 |
|
 Randy Wells
 |
Wells Randy |
RP |
$2,705,000 |
2705000 |
2.44% |
2.44 |
-0.76 |
-0.764804 |
— |
0 |
— |
0 |
|
 Chris Volstad
 |
Volstad Chris |
RP |
$2,655,000 |
2655000 |
2.39% |
2.39 |
-0.44 |
-0.438388 |
— |
0 |
— |
0 |
|
 Jeff Samardzija
 |
Samardzija Jeff |
RP |
$2,640,000 |
2640000 |
2.38% |
2.38 |
3.95 |
3.95234 |
1.50 |
1.4970984848485 |
$667,959 |
667958.72824706 |
|
 Ian Stewart
 |
Stewart Ian |
3B |
$2,237,500 |
2237500 |
2.02% |
2.02 |
-0.47 |
-0.465351 |
— |
0 |
— |
0 |
|
 Jorge Soler
 |
Soler Jorge |
DNP |
$1,666,667 |
1666667 |
1.50% |
1.50 |
— |
0.00 |
— |
0 |
— |
0 |
|
 Jeff Baker
 |
Baker Jeff |
1B |
$1,375,000 |
1375000 |
1.24% |
1.24 |
-0.04 |
-0.036877 |
— |
0 |
— |
0 |
|
 Gerardo Concepción
 |
Concepcion Gerardo |
DNP |
$1,200,000 |
1200000 |
1.08% |
1.08 |
— |
0.00 |
— |
0 |
— |
0 |
|
 Reed Johnson
 |
Johnson Reed |
PH |
$1,150,000 |
1150000 |
1.04% |
1.04 |
0.81 |
0.814653 |
0.71 |
0.70839391304348 |
$1,411,644 |
1411643.9760241 |
|
 Blake DeWitt
 |
DeWitt Blake |
PH |
$1,100,000 |
1100000 |
0.99% |
0.99 |
-0.10 |
-0.0986608 |
— |
0 |
— |
0 |
|
 Starlin Castro
 |
Castro Starlin |
SS |
$567,000 |
567000 |
0.51% |
0.51 |
3.93 |
3.92958 |
6.93 |
6.9304761904762 |
$144,290 |
144290.22949017 |
|
 Shawn Camp
 |
Camp Shawn |
RP |
$550,000 |
550000 |
0.50% |
0.50 |
0.09 |
0.0896781 |
0.16 |
0.16305109090909 |
$6,133,047 |
6133046.9757945 |
|
 James Russell
 |
Russell James |
RP |
$512,500 |
512500 |
0.46% |
0.46 |
0.41 |
0.412414 |
0.80 |
0.80471024390244 |
$1,242,683 |
1242683.3230686 |
|
 Darwin Barney
 |
Barney Darwin |
2B |
$500,000 |
500000 |
0.45% |
0.45 |
2.64 |
2.64147 |
5.28 |
5.28294 |
$189,289 |
189288.54009321 |
|
 Luis Valbuena
 |
Valbuena Luis |
3B |
$495,200 |
495200 |
0.45% |
0.45 |
0.26 |
0.262222 |
0.53 |
0.52952746365105 |
$1,888,476 |
1888476.1766747 |
|
 Joe Mather
 |
Mather Joe |
PH |
$490,000 |
490000 |
0.44% |
0.44 |
-0.75 |
-0.747732 |
— |
0 |
— |
0 |
|
 Marcos Mateo
 |
Mateo Marcos |
DNP |
$485,000 |
485000 |
0.44% |
0.44 |
— |
0.00 |
— |
0 |
— |
0 |
|
 Michael Bowden
 |
Bowden Michael |
RP |
$484,000 |
484000 |
0.44% |
0.44 |
-0.15 |
-0.14872 |
— |
0 |
— |
0 |
|
 Tony Campana
 |
Campana Tony |
CF |
$483,000 |
483000 |
0.44% |
0.44 |
0.00 |
0.00406444 |
0.01 |
0.0084149896480331 |
$118,835,559 |
118835559.14222 |
|
 Bryan LaHair
 |
LaHair Bryan |
1B |
$482,500 |
482500 |
0.43% |
0.43 |
0.32 |
0.323068 |
0.67 |
0.66957098445596 |
$1,493,494 |
1493493.6298241 |
|
 Rafael Dolis
 |
Dolis Rafael |
RP |
$480,500 |
480500 |
0.43% |
0.43 |
-1.31 |
-1.30632 |
— |
0 |
— |
0 |
|
 Steve Clevenger
 |
Clevenger Steve |
C |
$480,500 |
480500 |
0.43% |
0.43 |
-0.63 |
-0.631262 |
— |
0 |
— |
0 |
|
 Lendy Castillo
 |
Castillo Lendy |
RP |
$480,000 |
480000 |
0.43% |
0.43 |
-0.30 |
-0.303428 |
— |
0 |
— |
0 |
|
| Year | Cubs payroll |
PR Sort |
Avg payroll |
AvgPR Sort |
Diff |
Diff Sort |
|---|
| 2000 | $61,584,333 | 61584333 | $57,491,092 | 57491092 | $4,093,241 | 4093241 |
| 2001 | $64,315,833 | 64315833 | $67,120,750 | 67120750 | $-2,804,917 | -2804917 |
| 2002 | $74,959,833 | 74959833 | $69,204,705 | 69204705 | $5,755,128 | 5755128 |
| 2003 | $79,805,000 | 79805000 | $72,156,639 | 72156639 | $7,648,361 | 7648361 |
| 2004 | $89,226,667 | 89226667 | $71,426,357 | 71426357 | $17,800,310 | 17800310 |
| 2005 | $85,064,767 | 85064767 | $73,628,169 | 73628169 | $11,436,598 | 11436598 |
| 2006 | $93,257,833 | 93257833 | $81,192,832 | 81192832 | $12,065,001 | 12065001 |
| 2007 | $99,285,666 | 99285666 | $85,747,487 | 85747487 | $13,538,179 | 13538179 |
| 2008 | $120,270,833 | 120270833 | $93,079,041 | 93079041 | $27,191,792 | 27191792 |
| 2009 | $135,142,333 | 135142333 | $92,957,049 | 92957049 | $42,185,284 | 42185284 |
| 2010 | $143,359,000 | 143359000 | $94,957,956 | 94957956 | $48,401,044 | 48401044 |
| 2011 | $134,329,000 | 134329000 | $97,426,414 | 97426414 | $36,902,586 | 36902586 |
| 2012 | $111,034,202 | 111034202 | $100,689,500 | 100689500 | $10,344,702 | 10344702 |
| 2013 | $107,375,524 | 107375524 | $106,658,387 | 106658387 | $717,137 | 717137 |
| 2014 | $92,677,368 | 92677368 | $115,428,670 | 115428670 | $-22,751,302 | -22751302 |
| 2015 | $120,337,385 | 120337385 | $125,458,486 | 125458486 | $-5,121,101 | -5121101 |
| 2016 | $171,611,832 | 171611832 | $130,290,910 | 130290910 | $41,320,922 | 41320922 |
| 2017 | $172,199,881 | 172199881 | $136,573,000 | 136573000 | $35,626,881 | 35626881 |
| 2018 | $183,156,139 | 183156139 | $135,681,867 | 135681867 | $47,474,272 | 47474272 |
| 2019 | $214,246,988 | 214246988 | $134,776,225 | 134776225 | $79,470,763 | 79470763 |
| 2020 | $188,459,500 | 188459500 | $138,321,485 | 138321485 | $50,138,015 | 50138015 |
| 2021 | $152,542,000 | 152542000 | $129,635,938 | 129635938 | $22,906,062 | 22906062 |
| 2022 | $140,736,000 | 140736000 | $147,002,411 | 147002411 | $-6,266,411 | -6266411 |
| 2023 | $185,159,250 | 185159250 | $158,155,877 | 158155877 | $27,003,373 | 27003373 |
| 2024 | $192,295,000 | 192295000 | $133,074,721 | 133074721 | $59,220,279 | 59220279 |
| 2025 | $141,750,000 | 141750000 | $94,180,059 | 94180059 | $47,569,941 | 47569941 |
| 2026 | $136,250,000 | 136250000 | $74,818,461 | 74818461 | $61,431,539 | 61431539 |
| 2027 | $43,250,000 | 43250000 | $56,972,319 | 56972319 | $-13,722,319 | -13722319 |
| 2028 | $27,000,000 | 27000000 | $45,437,759 | 45437759 | $-18,437,759 | -18437759 |
| 2029 | $26,000,000 | 26000000 | $37,269,628 | 37269628 | $-11,269,628 | -11269628 |
|
 2012 Chicago Cubs