| Player | Player Sort | Pos | Salary | Salary Sort | Pct | Pct Sort | WARP | WARP Sort | WARP/$M | WARP/$M Sort | $/WARP | $/WARP Sort | Current Status |
|---|
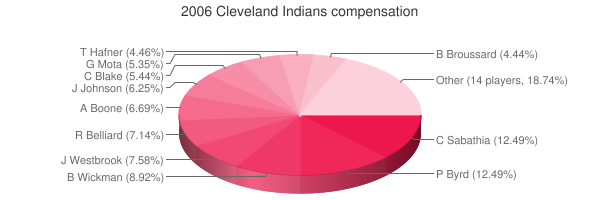
 Paul Byrd
 |
Byrd Paul |
RP |
$7,000,000 |
7000000 |
12.49% |
12.49 |
-2.39 |
-2.39435 |
— |
0 |
— |
0 |
|
 CC Sabathia
 |
Sabathia CC |
RP |
$7,000,000 |
7000000 |
12.49% |
12.49 |
4.53 |
4.52806 |
0.65 |
0.64686571428571 |
$1,545,916 |
1545915.9110082 |
|
 Bob Wickman
 |
Wickman Bob |
RP |
$5,000,000 |
5000000 |
8.92% |
8.92 |
0.32 |
0.32105 |
0.06 |
0.06421 |
$15,573,898 |
15573898.146706 |
|
 Jake Westbrook
 |
Westbrook Jake |
RP |
$4,250,000 |
4250000 |
7.58% |
7.58 |
1.94 |
1.93967 |
0.46 |
0.45639294117647 |
$2,191,094 |
2191094.361412 |
|
 Ronnie Belliard
 |
Belliard Ronnie |
2B |
$4,000,000 |
4000000 |
7.14% |
7.14 |
0.83 |
0.828876 |
0.21 |
0.207219 |
$4,825,812 |
4825812.3048562 |
|
 Aaron Boone
 |
Boone Aaron |
3B |
$3,750,000 |
3750000 |
6.69% |
6.69 |
-1.07 |
-1.06759 |
— |
0 |
— |
0 |
|
 Jason Johnson
 |
Johnson Jason |
RP |
$3,500,000 |
3500000 |
6.25% |
6.25 |
-0.20 |
-0.199259 |
— |
0 |
— |
0 |
|
 Casey Blake
 |
Blake Casey |
RF |
$3,050,000 |
3050000 |
5.44% |
5.44 |
1.15 |
1.14642 |
0.38 |
0.37587540983607 |
$2,660,456 |
2660456.0283317 |
|
 Guillermo Mota
 |
Mota Guillermo |
RP |
$3,000,000 |
3000000 |
5.35% |
5.35 |
-0.25 |
-0.25426 |
— |
0 |
— |
0 |
|
 Travis Hafner
 |
Hafner Travis |
DH |
$2,500,000 |
2500000 |
4.46% |
4.46 |
5.45 |
5.45084 |
2.18 |
2.180336 |
$458,645 |
458644.90610621 |
|
 Ben Broussard
 |
Broussard Ben |
1B |
$2,487,500 |
2487500 |
4.44% |
4.44 |
1.55 |
1.54813 |
0.62 |
0.62236381909548 |
$1,606,777 |
1606777.2086323 |
|
 Eduardo Perez
 |
Perez Eduardo |
1B |
$1,700,000 |
1700000 |
3.03% |
3.03 |
0.53 |
0.527451 |
0.31 |
0.31026529411765 |
$3,223,048 |
3223048.2073216 |
|
 Jason Michaels
 |
Michaels Jason |
LF |
$1,500,000 |
1500000 |
2.68% |
2.68 |
-1.01 |
-1.0148 |
— |
0 |
— |
0 |
|
 Scott Sauerbeck
 |
Sauerbeck Scott |
RP |
$1,200,000 |
1200000 |
2.14% |
2.14 |
-0.23 |
-0.231149 |
— |
0 |
— |
0 |
|
 Victor Martinez
 |
Martinez Victor |
C |
$1,000,000 |
1000000 |
1.78% |
1.78 |
2.24 |
2.2431 |
2.24 |
2.2431 |
$445,812 |
445811.60001783 |
|
 Todd Hollandsworth
 |
Hollandsworth Todd |
LF |
$900,000 |
900000 |
1.61% |
1.61 |
-0.09 |
-0.0860308 |
— |
0 |
— |
0 |
|
 Ramón Vázquez
 |
Vazquez Ramon |
3B |
$700,000 |
700000 |
1.25% |
1.25 |
-0.36 |
-0.359207 |
— |
0 |
— |
0 |
|
 Danny Graves
 |
Graves Danny |
RP |
$575,000 |
575000 |
1.03% |
1.03 |
-0.29 |
-0.285958 |
— |
0 |
— |
0 |
|
 Grady Sizemore
 |
Sizemore Grady |
CF |
$500,000 |
500000 |
0.89% |
0.89 |
4.16 |
4.16075 |
8.32 |
8.3215 |
$120,171 |
120170.64231208 |
|
 Jhonny Peralta
 |
Peralta Jhonny |
SS |
$500,000 |
500000 |
0.89% |
0.89 |
1.94 |
1.93719 |
3.87 |
3.87438 |
$258,106 |
258105.81305912 |
|
 Brian Sikorski
 |
Sikorski Brian |
RP |
$500,000 |
500000 |
0.89% |
0.89 |
0.28 |
0.276484 |
0.55 |
0.552968 |
$1,808,423 |
1808422.9105482 |
|
 Cliff Lee
 |
Lee Cliff |
RP |
$406,200 |
406200 |
0.72% |
0.72 |
-2.12 |
-2.12001 |
— |
0 |
— |
0 |
|
 Rafael Betancourt
 |
Betancourt Rafael |
RP |
$365,300 |
365300 |
0.65% |
0.65 |
0.18 |
0.184171 |
0.50 |
0.50416370106762 |
$1,983,483 |
1983482.7415826 |
|
 Fernando Cabrera
 |
Cabrera Fernando |
RP |
$330,800 |
330800 |
0.59% |
0.59 |
1.14 |
1.14244 |
3.45 |
3.4535671100363 |
$289,556 |
289555.68782606 |
|
 Kelly Shoppach
 |
Shoppach Kelly |
C |
$327,000 |
327000 |
0.58% |
0.58 |
-0.38 |
-0.381506 |
— |
0 |
— |
0 |
|
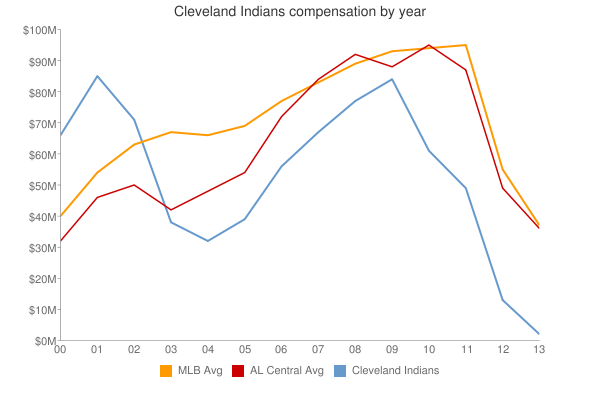
| Year | Indians payroll |
PR Sort |
Avg payroll |
AvgPR Sort |
Diff |
Diff Sort |
|---|
| 2000 | $76,938,090 | 76938090 | $56,164,089 | 56164089 | $20,774,001 | 20774001 |
| 2001 | $93,672,001 | 93672001 | $65,991,638 | 65991638 | $27,680,363 | 27680363 |
| 2002 | $78,691,449 | 78691449 | $68,244,471 | 68244471 | $10,446,978 | 10446978 |
| 2003 | $47,770,900 | 47770900 | $71,318,479 | 71318479 | $-23,547,579 | -23547579 |
| 2004 | $34,910,300 | 34910300 | $70,466,961 | 70466961 | $-35,556,661 | -35556661 |
| 2005 | $40,873,600 | 40873600 | $73,264,780 | 73264780 | $-32,391,180 | -32391180 |
| 2006 | $56,041,800 | 56041800 | $79,051,754 | 79051754 | $-23,009,954 | -23009954 |
| 2007 | $61,452,100 | 61452100 | $83,931,138 | 83931138 | $-22,479,038 | -22479038 |
| 2008 | $77,258,400 | 77258400 | $90,812,373 | 90812373 | $-13,553,973 | -13553973 |
| 2009 | $81,972,100 | 81972100 | $91,093,211 | 91093211 | $-9,121,111 | -9121111 |
| 2010 | $61,203,967 | 61203967 | $93,373,681 | 93373681 | $-32,169,714 | -32169714 |
| 2011 | $49,426,567 | 49426567 | $96,102,034 | 96102034 | $-46,675,467 | -46675467 |
| 2012 | $66,880,300 | 66880300 | $100,657,138 | 100657138 | $-33,776,838 | -33776838 |
| 2013 | $78,955,733 | 78955733 | $109,024,990 | 109024990 | $-30,069,257 | -30069257 |
| 2014 | $86,916,235 | 86916235 | $117,828,782 | 117828782 | $-30,912,547 | -30912547 |
| 2015 | $87,997,101 | 87997101 | $127,404,244 | 127404244 | $-39,407,143 | -39407143 |
| 2016 | $96,304,400 | 96304400 | $132,219,407 | 132219407 | $-35,915,007 | -35915007 |
| 2017 | $124,116,166 | 124116166 | $137,302,894 | 137302894 | $-13,186,728 | -13186728 |
| 2018 | $134,851,566 | 134851566 | $136,929,168 | 136929168 | $-2,077,602 | -2077602 |
| 2019 | $119,575,034 | 119575034 | $136,944,257 | 136944257 | $-17,369,223 | -17369223 |
| 2020 | $92,781,066 | 92781066 | $140,677,788 | 140677788 | $-47,896,722 | -47896722 |
| 2021 | $52,028,300 | 52028300 | $132,162,631 | 132162631 | $-80,134,331 | -80134331 |
| 2022 | $68,037,200 | 68037200 | $149,374,046 | 149374046 | $-81,336,846 | -81336846 |
| 2023 | $89,424,629 | 89424629 | $160,460,390 | 160460390 | $-71,035,761 | -71035761 |
| 2024 | $49,621,429 | 49621429 | $135,504,022 | 135504022 | $-85,882,593 | -85882593 |
| 2025 | $45,171,429 | 45171429 | $96,417,302 | 96417302 | $-51,245,873 | -51245873 |
| 2026 | $53,871,429 | 53871429 | $76,694,120 | 76694120 | $-22,822,691 | -22822691 |
| 2027 | $51,571,429 | 51571429 | $58,935,617 | 58935617 | $-7,364,188 | -7364188 |
| 2028 | $48,571,429 | 48571429 | $45,437,759 | 45437759 | $3,133,670 | 3133670 |
| 2029 | $23,571,429 | 23571429 | $37,269,628 | 37269628 | $-13,698,199 | -13698199 |
| 2030 | $2,500,000 | 2500000 | $39,665,769 | 39665769 | $-37,165,769 | -37165769 |
|
 2006 Cleveland Indians