| Player | Player Sort | Pos | Salary | Salary Sort | Pct | Pct Sort | WARP | WARP Sort | WARP/$M | WARP/$M Sort | $/WARP | $/WARP Sort | Current Status |
|---|
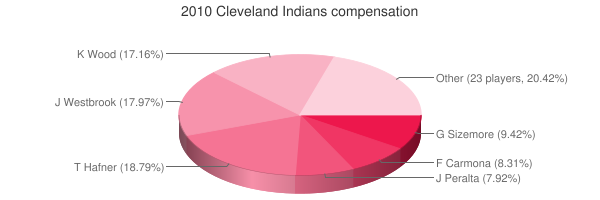
 Travis Hafner
 |
Hafner Travis |
DH |
$11,500,000 |
11500000 |
18.79% |
18.79 |
1.68 |
1.68248 |
0.15 |
0.14630260869565 |
$6,835,148 |
6835148.1146878 |
|
 Jake Westbrook
 |
Westbrook Jake |
RP |
$11,000,000 |
11000000 |
17.97% |
17.97 |
1.02 |
1.0162 |
0.09 |
0.092381818181818 |
$10,824,641 |
10824640.818736 |
|
 Kerry Wood
 |
Wood Kerry |
RP |
$10,500,000 |
10500000 |
17.16% |
17.16 |
-0.06 |
-0.0603428 |
— |
0 |
— |
0 |
|
 Grady Sizemore
 |
Sizemore Grady |
CF |
$5,766,667 |
5766667 |
9.42% |
9.42 |
-0.85 |
-0.849573 |
— |
0 |
— |
0 |
|
 Roberto Hernandez
 |
Hernandez Roberto |
RP |
$5,087,500 |
5087500 |
8.31% |
8.31 |
2.15 |
2.1464 |
0.42 |
0.42189680589681 |
$2,370,248 |
2370247.8568766 |
|
 Jhonny Peralta
 |
Peralta Jhonny |
3B |
$4,850,000 |
4850000 |
7.92% |
7.92 |
0.89 |
0.889881 |
0.18 |
0.1834806185567 |
$5,450,167 |
5450166.9324325 |
|
 Russell Branyan
 |
Branyan Russell |
1B |
$1,500,000 |
1500000 |
2.45% |
2.45 |
0.86 |
0.863189 |
0.58 |
0.57545933333333 |
$1,737,742 |
1737742.2557516 |
|
 Jamey Wright
 |
Wright Jamey |
RP |
$900,000 |
900000 |
1.47% |
1.47 |
-0.12 |
-0.124091 |
— |
0 |
— |
0 |
|
 Mike Redmond
 |
Redmond Mike |
C |
$850,000 |
850000 |
1.39% |
1.39 |
-0.48 |
-0.476813 |
— |
0 |
— |
0 |
|
 Rafael Perez
 |
Perez Rafael |
RP |
$795,000 |
795000 |
1.30% |
1.30 |
-0.10 |
-0.104004 |
— |
0 |
— |
0 |
|
 Austin Kearns
 |
Kearns Austin |
LF |
$750,000 |
750000 |
1.23% |
1.23 |
1.14 |
1.13824 |
1.52 |
1.5176533333333 |
$658,912 |
658912.00449817 |
|
 Mark Grudzielanek
 |
Grudzielanek Mark |
2B |
$600,000 |
600000 |
0.98% |
0.98 |
-0.37 |
-0.370181 |
— |
0 |
— |
0 |
FA/2011 |
 Shin-Soo Choo
 |
Choo Shin-Soo |
RF |
$461,100 |
461100 |
0.75% |
0.75 |
4.80 |
4.80484 |
10.42 |
10.420386033398 |
$95,966 |
95965.734550994 |
|
 Asdrúbal Cabrera
 |
Cabrera Asdrubal |
SS |
$444,600 |
444600 |
0.73% |
0.73 |
0.62 |
0.623667 |
1.40 |
1.4027597840756 |
$712,880 |
712880.43138406 |
|
 Joe Smith
 |
Smith Joe |
RP |
$427,500 |
427500 |
0.70% |
0.70 |
-0.75 |
-0.753152 |
— |
0 |
— |
0 |
|
 Justin Masterson
 |
Masterson Justin |
RP |
$427,000 |
427000 |
0.70% |
0.70 |
0.18 |
0.182218 |
0.43 |
0.42674004683841 |
$2,343,347 |
2343346.979991 |
|
 Anthony Reyes
 |
Reyes Anthony |
DNP |
$425,000 |
425000 |
0.69% |
0.69 |
— |
0.00 |
— |
0 |
— |
0 |
|
 Chris Perez
 |
Perez Chris |
RP |
$423,800 |
423800 |
0.69% |
0.69 |
0.39 |
0.38704 |
0.91 |
0.91326097215668 |
$1,094,977 |
1094977.263332 |
|
 Jensen Lewis
 |
Lewis Jensen |
RP |
$422,400 |
422400 |
0.69% |
0.69 |
-0.24 |
-0.244541 |
— |
0 |
— |
0 |
|
 Aaron Laffey
 |
Laffey Aaron |
RP |
$421,900 |
421900 |
0.69% |
0.69 |
-0.99 |
-0.993863 |
— |
0 |
— |
0 |
|
 Luis Valbuena
 |
Valbuena Luis |
2B |
$414,700 |
414700 |
0.68% |
0.68 |
-0.96 |
-0.95585 |
— |
0 |
— |
0 |
|
 Andy Marte
 |
Marte Andy |
3B |
$413,400 |
413400 |
0.68% |
0.68 |
0.30 |
0.29659 |
0.72 |
0.71744073536526 |
$1,393,843 |
1393843.3527766 |
|
 David Huff
 |
Huff David |
RP |
$410,700 |
410700 |
0.67% |
0.67 |
-2.20 |
-2.19794 |
— |
0 |
— |
0 |
|
 Tony Sipp
 |
Sipp Tony |
RP |
$407,300 |
407300 |
0.67% |
0.67 |
-0.04 |
-0.0407412 |
— |
0 |
— |
0 |
|
 Matt LaPorta
 |
LaPorta Matt |
1B |
$402,700 |
402700 |
0.66% |
0.66 |
-2.48 |
-2.48184 |
— |
0 |
— |
0 |
|
 Lou Marson
 |
Marson Lou |
C |
$401,200 |
401200 |
0.66% |
0.66 |
-1.06 |
-1.05617 |
— |
0 |
— |
0 |
|
 Michael Brantley
 |
Brantley Michael |
CF |
$400,800 |
400800 |
0.65% |
0.65 |
-0.48 |
-0.479724 |
— |
0 |
— |
0 |
|
 Mitch Talbot
 |
Talbot Mitch |
RP |
$400,700 |
400700 |
0.65% |
0.65 |
-0.95 |
-0.945816 |
— |
0 |
— |
0 |
|
 Hector Ambriz
 |
Ambriz Hector |
RP |
$400,000 |
400000 |
0.65% |
0.65 |
-0.24 |
-0.238414 |
— |
0 |
— |
0 |
|
| Year | Indians payroll |
PR Sort |
Avg payroll |
AvgPR Sort |
Diff |
Diff Sort |
|---|
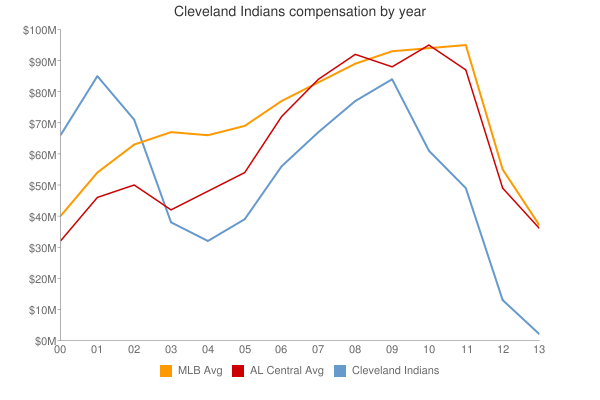
| 2000 | $76,938,090 | 76938090 | $56,164,089 | 56164089 | $20,774,001 | 20774001 |
| 2001 | $93,672,001 | 93672001 | $65,991,638 | 65991638 | $27,680,363 | 27680363 |
| 2002 | $78,691,449 | 78691449 | $68,244,471 | 68244471 | $10,446,978 | 10446978 |
| 2003 | $47,770,900 | 47770900 | $71,318,479 | 71318479 | $-23,547,579 | -23547579 |
| 2004 | $34,910,300 | 34910300 | $70,466,961 | 70466961 | $-35,556,661 | -35556661 |
| 2005 | $40,873,600 | 40873600 | $73,264,780 | 73264780 | $-32,391,180 | -32391180 |
| 2006 | $56,041,800 | 56041800 | $79,051,754 | 79051754 | $-23,009,954 | -23009954 |
| 2007 | $61,452,100 | 61452100 | $83,931,138 | 83931138 | $-22,479,038 | -22479038 |
| 2008 | $77,258,400 | 77258400 | $90,812,373 | 90812373 | $-13,553,973 | -13553973 |
| 2009 | $81,972,100 | 81972100 | $91,093,211 | 91093211 | $-9,121,111 | -9121111 |
| 2010 | $61,203,967 | 61203967 | $93,373,681 | 93373681 | $-32,169,714 | -32169714 |
| 2011 | $49,426,567 | 49426567 | $96,102,034 | 96102034 | $-46,675,467 | -46675467 |
| 2012 | $66,880,300 | 66880300 | $100,657,138 | 100657138 | $-33,776,838 | -33776838 |
| 2013 | $78,955,733 | 78955733 | $109,024,990 | 109024990 | $-30,069,257 | -30069257 |
| 2014 | $86,916,235 | 86916235 | $117,828,782 | 117828782 | $-30,912,547 | -30912547 |
| 2015 | $87,997,101 | 87997101 | $127,404,244 | 127404244 | $-39,407,143 | -39407143 |
| 2016 | $96,304,400 | 96304400 | $132,219,407 | 132219407 | $-35,915,007 | -35915007 |
| 2017 | $124,116,166 | 124116166 | $137,302,894 | 137302894 | $-13,186,728 | -13186728 |
| 2018 | $134,851,566 | 134851566 | $136,929,168 | 136929168 | $-2,077,602 | -2077602 |
| 2019 | $119,575,034 | 119575034 | $136,944,257 | 136944257 | $-17,369,223 | -17369223 |
| 2020 | $92,781,066 | 92781066 | $140,677,788 | 140677788 | $-47,896,722 | -47896722 |
| 2021 | $52,028,300 | 52028300 | $132,162,631 | 132162631 | $-80,134,331 | -80134331 |
| 2022 | $68,037,200 | 68037200 | $149,374,046 | 149374046 | $-81,336,846 | -81336846 |
| 2023 | $89,424,629 | 89424629 | $160,460,390 | 160460390 | $-71,035,761 | -71035761 |
| 2024 | $49,621,429 | 49621429 | $135,504,022 | 135504022 | $-85,882,593 | -85882593 |
| 2025 | $45,171,429 | 45171429 | $96,417,302 | 96417302 | $-51,245,873 | -51245873 |
| 2026 | $53,871,429 | 53871429 | $76,694,120 | 76694120 | $-22,822,691 | -22822691 |
| 2027 | $51,571,429 | 51571429 | $58,935,617 | 58935617 | $-7,364,188 | -7364188 |
| 2028 | $48,571,429 | 48571429 | $45,437,759 | 45437759 | $3,133,670 | 3133670 |
| 2029 | $23,571,429 | 23571429 | $37,269,628 | 37269628 | $-13,698,199 | -13698199 |
| 2030 | $2,500,000 | 2500000 | $39,665,769 | 39665769 | $-37,165,769 | -37165769 |
|
 2010 Cleveland Indians