| Player | Player Sort | Pos | Salary | Salary Sort | Pct | Pct Sort | WARP | WARP Sort | WARP/$M | WARP/$M Sort | $/WARP | $/WARP Sort | Current Status |
|---|
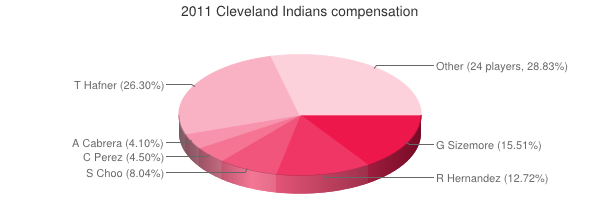
 Travis Hafner
 |
Hafner Travis |
DH |
$13,000,000 |
13000000 |
26.30% |
26.30 |
1.38 |
1.37916 |
0.11 |
0.10608923076923 |
$9,426,027 |
9426027.4369906 |
|
 Grady Sizemore
 |
Sizemore Grady |
CF |
$7,666,667 |
7666667 |
15.51% |
15.51 |
-0.11 |
-0.108344 |
— |
0 |
— |
0 |
|
 Roberto Hernandez
 |
Hernandez Roberto |
RP |
$6,287,500 |
6287500 |
12.72% |
12.72 |
-1.83 |
-1.83484 |
— |
0 |
— |
0 |
|
 Shin-Soo Choo
 |
Choo Shin-Soo |
RF |
$3,975,000 |
3975000 |
8.04% |
8.04 |
1.79 |
1.7918 |
0.45 |
0.45076729559748 |
$2,218,440 |
2218439.5579864 |
|
 Chris Perez
 |
Perez Chris |
RP |
$2,225,000 |
2225000 |
4.50% |
4.50 |
-0.65 |
-0.649412 |
— |
0 |
— |
0 |
|
 Asdrúbal Cabrera
 |
Cabrera Asdrubal |
SS |
$2,025,000 |
2025000 |
4.10% |
4.10 |
2.40 |
2.40491 |
1.19 |
1.1876098765432 |
$842,027 |
842027.35237493 |
|
 Rafael Perez
 |
Perez Rafael |
RP |
$1,330,000 |
1330000 |
2.69% |
2.69 |
0.74 |
0.736801 |
0.55 |
0.55398571428571 |
$1,805,101 |
1805100.6988318 |
|
 Austin Kearns
 |
Kearns Austin |
LF |
$1,300,000 |
1300000 |
2.63% |
2.63 |
-0.10 |
-0.104686 |
— |
0 |
— |
0 |
|
 Orlando Cabrera
 |
Cabrera Orlando |
2B |
$1,000,000 |
1000000 |
2.02% |
2.02 |
-1.04 |
-1.04211 |
— |
0 |
— |
0 |
|
 Joe Smith
 |
Smith Joe |
RP |
$870,000 |
870000 |
1.76% |
1.76 |
0.10 |
0.100443 |
0.12 |
0.11545172413793 |
$8,661,629 |
8661628.9836026 |
|
 Chad Durbin
 |
Durbin Chad |
RP |
$800,000 |
800000 |
1.62% |
1.62 |
-0.01 |
-0.010957 |
— |
0 |
— |
0 |
|
 Adam Everett
 |
Everett Adam |
3B |
$700,000 |
700000 |
1.42% |
1.42 |
-0.12 |
-0.115748 |
— |
0 |
— |
0 |
|
 Jensen Lewis
 |
Lewis Jensen |
DNP |
$650,000 |
650000 |
1.32% |
1.32 |
— |
0.00 |
— |
0 |
— |
0 |
|
 Travis Buck
 |
Buck Travis |
LF |
$625,000 |
625000 |
1.26% |
1.26 |
0.00 |
0.00038255 |
0.00 |
0.00061208 |
$1,633,773,363 |
1633773362.9591 |
|
 Jack Hannahan
 |
Hannahan Jack |
3B |
$500,000 |
500000 |
1.01% |
1.01 |
2.89 |
2.89222 |
5.78 |
5.78444 |
$172,878 |
172877.58192669 |
|
 Shelley Duncan
 |
Duncan Shelley |
LF |
$500,000 |
500000 |
1.01% |
1.01 |
1.16 |
1.16289 |
2.33 |
2.32578 |
$429,963 |
429963.28113579 |
|
 Justin Masterson
 |
Masterson Justin |
RP |
$468,400 |
468400 |
0.95% |
0.95 |
1.66 |
1.66 |
3.54 |
3.5439795046968 |
$282,169 |
282168.6746988 |
|
 Tony Sipp
 |
Sipp Tony |
RP |
$436,800 |
436800 |
0.88% |
0.88 |
0.50 |
0.497478 |
1.14 |
1.1389148351648 |
$878,029 |
878028.77715195 |
|
 Trevor Crowe
 |
Crowe Trevor |
LF |
$435,700 |
435700 |
0.88% |
0.88 |
-0.40 |
-0.40326 |
— |
0 |
— |
0 |
|
 Mitch Talbot
 |
Talbot Mitch |
RP |
$431,700 |
431700 |
0.87% |
0.87 |
-1.42 |
-1.41773 |
— |
0 |
— |
0 |
|
 Matt LaPorta
 |
LaPorta Matt |
1B |
$431,400 |
431400 |
0.87% |
0.87 |
-0.75 |
-0.748189 |
— |
0 |
— |
0 |
|
 Lou Marson
 |
Marson Lou |
C |
$424,300 |
424300 |
0.86% |
0.86 |
-1.28 |
-1.27547 |
— |
0 |
— |
0 |
|
 Jason Donald
 |
Donald Jason |
2B |
$423,200 |
423200 |
0.86% |
0.86 |
0.68 |
0.684583 |
1.62 |
1.6176346880907 |
$618,187 |
618186.54567817 |
|
 Michael Brantley
 |
Brantley Michael |
LF |
$421,800 |
421800 |
0.85% |
0.85 |
0.51 |
0.514213 |
1.22 |
1.2190919867236 |
$820,283 |
820282.64551849 |
|
 Frank Herrmann
 |
Herrmann Frank |
RP |
$419,800 |
419800 |
0.85% |
0.85 |
-0.69 |
-0.693385 |
— |
0 |
— |
0 |
|
 Josh Tomlin
 |
Tomlin Josh |
RP |
$417,200 |
417200 |
0.84% |
0.84 |
1.38 |
1.38444 |
3.32 |
3.3184084372004 |
$301,349 |
301349.28202017 |
|
 Carlos Santana
 |
Santana Carlos |
C |
$416,600 |
416600 |
0.84% |
0.84 |
0.75 |
0.746386 |
1.79 |
1.7916130580893 |
$558,156 |
558156.23551353 |
|
 Carlos Carrasco
 |
Carrasco Carlos |
RP |
$415,800 |
415800 |
0.84% |
0.84 |
0.18 |
0.1824 |
0.44 |
0.43867243867244 |
$2,279,605 |
2279605.2631579 |
|
 Justin Germano
 |
Germano Justin |
RP |
$415,600 |
415600 |
0.84% |
0.84 |
-0.23 |
-0.226506 |
— |
0 |
— |
0 |
|
 Vinnie Pestano
 |
Pestano Vinnie |
RP |
$414,100 |
414100 |
0.84% |
0.84 |
1.37 |
1.37158 |
3.31 |
3.3121951219512 |
$301,915 |
301914.5802651 |
|
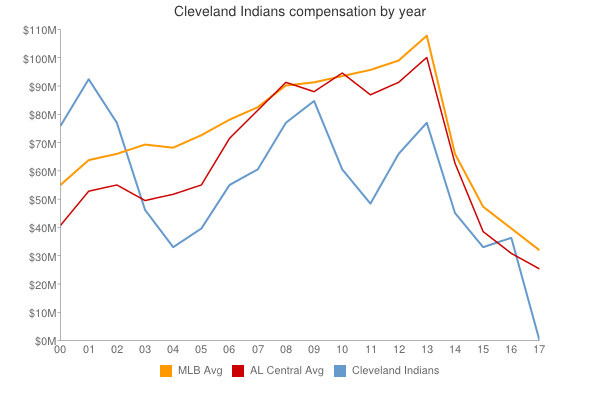
| Year | Indians payroll |
PR Sort |
Avg payroll |
AvgPR Sort |
Diff |
Diff Sort |
|---|
| 2000 | $76,938,090 | 76938090 | $56,164,089 | 56164089 | $20,774,001 | 20774001 |
| 2001 | $93,672,001 | 93672001 | $65,991,638 | 65991638 | $27,680,363 | 27680363 |
| 2002 | $78,691,449 | 78691449 | $68,244,471 | 68244471 | $10,446,978 | 10446978 |
| 2003 | $47,770,900 | 47770900 | $71,318,479 | 71318479 | $-23,547,579 | -23547579 |
| 2004 | $34,910,300 | 34910300 | $70,466,961 | 70466961 | $-35,556,661 | -35556661 |
| 2005 | $40,873,600 | 40873600 | $73,264,780 | 73264780 | $-32,391,180 | -32391180 |
| 2006 | $56,041,800 | 56041800 | $79,051,754 | 79051754 | $-23,009,954 | -23009954 |
| 2007 | $61,452,100 | 61452100 | $83,931,138 | 83931138 | $-22,479,038 | -22479038 |
| 2008 | $77,258,400 | 77258400 | $90,812,373 | 90812373 | $-13,553,973 | -13553973 |
| 2009 | $81,972,100 | 81972100 | $91,093,211 | 91093211 | $-9,121,111 | -9121111 |
| 2010 | $61,203,967 | 61203967 | $93,373,681 | 93373681 | $-32,169,714 | -32169714 |
| 2011 | $49,426,567 | 49426567 | $96,102,034 | 96102034 | $-46,675,467 | -46675467 |
| 2012 | $66,880,300 | 66880300 | $100,657,138 | 100657138 | $-33,776,838 | -33776838 |
| 2013 | $78,955,733 | 78955733 | $109,024,990 | 109024990 | $-30,069,257 | -30069257 |
| 2014 | $86,916,235 | 86916235 | $117,828,782 | 117828782 | $-30,912,547 | -30912547 |
| 2015 | $87,997,101 | 87997101 | $127,404,244 | 127404244 | $-39,407,143 | -39407143 |
| 2016 | $96,304,400 | 96304400 | $132,219,407 | 132219407 | $-35,915,007 | -35915007 |
| 2017 | $124,116,166 | 124116166 | $137,302,894 | 137302894 | $-13,186,728 | -13186728 |
| 2018 | $134,851,566 | 134851566 | $136,929,168 | 136929168 | $-2,077,602 | -2077602 |
| 2019 | $119,575,034 | 119575034 | $136,944,257 | 136944257 | $-17,369,223 | -17369223 |
| 2020 | $92,781,066 | 92781066 | $140,677,788 | 140677788 | $-47,896,722 | -47896722 |
| 2021 | $52,028,300 | 52028300 | $132,162,631 | 132162631 | $-80,134,331 | -80134331 |
| 2022 | $68,037,200 | 68037200 | $149,374,046 | 149374046 | $-81,336,846 | -81336846 |
| 2023 | $89,424,629 | 89424629 | $160,460,390 | 160460390 | $-71,035,761 | -71035761 |
| 2024 | $49,621,429 | 49621429 | $135,504,022 | 135504022 | $-85,882,593 | -85882593 |
| 2025 | $45,171,429 | 45171429 | $96,417,302 | 96417302 | $-51,245,873 | -51245873 |
| 2026 | $53,871,429 | 53871429 | $76,694,120 | 76694120 | $-22,822,691 | -22822691 |
| 2027 | $51,571,429 | 51571429 | $58,935,617 | 58935617 | $-7,364,188 | -7364188 |
| 2028 | $48,571,429 | 48571429 | $45,437,759 | 45437759 | $3,133,670 | 3133670 |
| 2029 | $23,571,429 | 23571429 | $37,269,628 | 37269628 | $-13,698,199 | -13698199 |
| 2030 | $2,500,000 | 2500000 | $39,665,769 | 39665769 | $-37,165,769 | -37165769 |
|
 2011 Cleveland Indians