| Player | Player Sort | Pos | Salary | Salary Sort | Pct | Pct Sort | WARP | WARP Sort | WARP/$M | WARP/$M Sort | $/WARP | $/WARP Sort | Current Status |
|---|
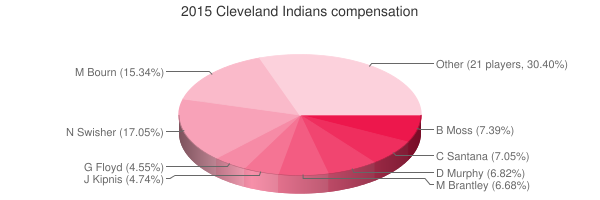
 Nick Swisher
 |
Swisher Nick |
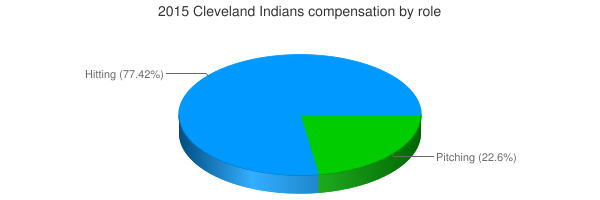
DH |
$15,000,000 |
15000000 |
17.05% |
17.05 |
-0.66 |
-0.656515 |
— |
0 |
— |
0 |
|
 Michael Bourn
 |
Bourn Michael |
CF |
$13,500,000 |
13500000 |
15.34% |
15.34 |
0.03 |
0.0344999 |
0.00 |
0.0025555481481481 |
$391,305,482 |
391305482.04488 |
|
 Brandon Moss
 |
Moss Brandon |
RF |
$6,500,000 |
6500000 |
7.39% |
7.39 |
-0.01 |
-0.00550365 |
— |
0 |
— |
0 |
|
 Carlos Santana
 |
Santana Carlos |
1B |
$6,200,000 |
6200000 |
7.05% |
7.05 |
0.30 |
0.302835 |
0.05 |
0.04884435483871 |
$20,473,195 |
20473194.974161 |
|
 David Murphy
 |
Murphy David |
DH |
$6,000,000 |
6000000 |
6.82% |
6.82 |
0.35 |
0.348457 |
0.06 |
0.058076166666667 |
$17,218,767 |
17218767.308448 |
|
 Michael Brantley
 |
Brantley Michael |
LF |
$5,875,000 |
5875000 |
6.68% |
6.68 |
2.92 |
2.92222 |
0.50 |
0.49739914893617 |
$2,010,458 |
2010457.8026295 |
|
 Jason Kipnis
 |
Kipnis Jason |
2B |
$4,166,667 |
4166667 |
4.74% |
4.74 |
3.07 |
3.07269 |
0.74 |
0.73744554100436 |
$1,356,032 |
1356032.3364869 |
|
 Gavin Floyd
 |
Floyd Gavin |
RP |
$4,000,000 |
4000000 |
4.55% |
4.55 |
-0.02 |
-0.020792 |
— |
0 |
— |
0 |
|
 Mike Aviles
 |
Aviles Mike |
LF |
$3,500,000 |
3500000 |
3.98% |
3.98 |
-0.52 |
-0.516569 |
— |
0 |
— |
0 |
|
 Ryan Raburn
 |
Raburn Ryan |
DH |
$2,500,000 |
2500000 |
2.84% |
2.84 |
1.52 |
1.52139 |
0.61 |
0.608556 |
$1,643,234 |
1643234.1477202 |
|
 Marc Rzepczynski
 |
Rzepczynski Marc |
RP |
$2,400,000 |
2400000 |
2.73% |
2.73 |
0.10 |
0.104924 |
0.04 |
0.043718333333333 |
$22,873,699 |
22873699.058366 |
|
 Carlos Carrasco
 |
Carrasco Carlos |
RP |
$2,337,500 |
2337500 |
2.66% |
2.66 |
5.58 |
5.58431 |
2.39 |
2.3890096256684 |
$418,583 |
418583.49554376 |
|
 Lonnie Chisenhall
 |
Chisenhall Lonnie |
RF |
$2,250,000 |
2250000 |
2.56% |
2.56 |
1.02 |
1.01804 |
0.45 |
0.45246222222222 |
$2,210,129 |
2210129.2680052 |
|
 Trevor Bauer
 |
Bauer Trevor |
RP |
$1,940,000 |
1940000 |
2.20% |
2.20 |
0.70 |
0.697772 |
0.36 |
0.35967628865979 |
$2,780,278 |
2780277.7984786 |
|
 Bryan Shaw
 |
Shaw Bryan |
RP |
$1,550,000 |
1550000 |
1.76% |
1.76 |
1.22 |
1.2197 |
0.79 |
0.78690322580645 |
$1,270,804 |
1270804.2961384 |
|
 Josh Tomlin
 |
Tomlin Josh |
RP |
$1,500,000 |
1500000 |
1.70% |
1.70 |
0.04 |
0.041891 |
0.03 |
0.027927333333333 |
$35,807,214 |
35807213.960039 |
|
 Corey Kluber
 |
Kluber Corey |
RP |
$1,200,000 |
1200000 |
1.36% |
1.36 |
5.83 |
5.83182 |
4.86 |
4.85985 |
$205,768 |
205767.66772637 |
|
 Yan Gomes
 |
Gomes Yan |
C |
$1,083,334 |
1083334 |
1.23% |
1.23 |
0.77 |
0.774733 |
0.72 |
0.71513771376141 |
$1,398,332 |
1398332.0705327 |
|
 Anthony Swarzak
 |
Swarzak Anthony |
RP |
$950,000 |
950000 |
1.08% |
1.08 |
0.26 |
0.255989 |
0.27 |
0.26946210526316 |
$3,711,097 |
3711096.9611976 |
|
 Scott Atchison
 |
Atchison Scott |
RP |
$900,000 |
900000 |
1.02% |
1.02 |
-0.13 |
-0.127293 |
— |
0 |
— |
0 |
|
 Cody Allen
 |
Allen Cody |
RP |
$547,100 |
547100 |
0.62% |
0.62 |
2.08 |
2.08475 |
3.81 |
3.810546518004 |
$262,430 |
262429.54790742 |
|
 Zach McAllister
 |
McAllister Zach |
RP |
$520,400 |
520400 |
0.59% |
0.59 |
1.15 |
1.14805 |
2.21 |
2.2060914681015 |
$453,290 |
453290.36191803 |
|
 Nick Hagadone
 |
Hagadone Nick |
RP |
$517,100 |
517100 |
0.59% |
0.59 |
0.16 |
0.158304 |
0.31 |
0.30613807774125 |
$3,266,500 |
3266499.8989286 |
|
 TJ House
 |
House TJ |
RP |
$511,900 |
511900 |
0.58% |
0.58 |
-0.59 |
-0.588664 |
— |
0 |
— |
0 |
|
 José Ramírez
 |
Ramirez Jose |
SS |
$511,300 |
511300 |
0.58% |
0.58 |
0.42 |
0.416339 |
0.81 |
0.8142753764913 |
$1,228,086 |
1228085.7666469 |
|
 Kyle Crockett
 |
Crockett Kyle |
RP |
$510,900 |
510900 |
0.58% |
0.58 |
0.04 |
0.0414389 |
0.08 |
0.08110961049129 |
$12,328,995 |
12328995.219468 |
|
 Zach Walters
 |
Walters Zach |
PH |
$509,600 |
509600 |
0.58% |
0.58 |
-0.36 |
-0.360907 |
— |
0 |
— |
0 |
|
 Roberto Pérez
 |
Perez Roberto |
C |
$508,600 |
508600 |
0.58% |
0.58 |
1.87 |
1.87156 |
3.68 |
3.6798269760126 |
$271,752 |
271751.90749963 |
|
 Austin Adams
 |
Adams Austin |
RP |
$507,700 |
507700 |
0.58% |
0.58 |
-0.21 |
-0.208228 |
— |
0 |
— |
0 |
|
| Year | Indians payroll |
PR Sort |
Avg payroll |
AvgPR Sort |
Diff |
Diff Sort |
|---|
| 2000 | $76,938,090 | 76938090 | $57,491,092 | 57491092 | $19,446,998 | 19446998 |
| 2001 | $93,672,001 | 93672001 | $67,120,750 | 67120750 | $26,551,251 | 26551251 |
| 2002 | $78,691,449 | 78691449 | $69,204,705 | 69204705 | $9,486,744 | 9486744 |
| 2003 | $47,770,900 | 47770900 | $72,156,639 | 72156639 | $-24,385,739 | -24385739 |
| 2004 | $34,910,300 | 34910300 | $71,426,357 | 71426357 | $-36,516,057 | -36516057 |
| 2005 | $40,873,600 | 40873600 | $73,628,169 | 73628169 | $-32,754,569 | -32754569 |
| 2006 | $56,041,800 | 56041800 | $81,192,832 | 81192832 | $-25,151,032 | -25151032 |
| 2007 | $61,452,100 | 61452100 | $85,747,487 | 85747487 | $-24,295,387 | -24295387 |
| 2008 | $77,258,400 | 77258400 | $93,079,041 | 93079041 | $-15,820,641 | -15820641 |
| 2009 | $81,972,100 | 81972100 | $92,957,049 | 92957049 | $-10,984,949 | -10984949 |
| 2010 | $61,203,967 | 61203967 | $94,957,956 | 94957956 | $-33,753,989 | -33753989 |
| 2011 | $49,426,567 | 49426567 | $97,426,414 | 97426414 | $-47,999,847 | -47999847 |
| 2012 | $66,880,300 | 66880300 | $100,689,500 | 100689500 | $-33,809,200 | -33809200 |
| 2013 | $78,955,733 | 78955733 | $106,658,387 | 106658387 | $-27,702,654 | -27702654 |
| 2014 | $86,916,235 | 86916235 | $115,428,670 | 115428670 | $-28,512,435 | -28512435 |
| 2015 | $87,997,101 | 87997101 | $125,458,486 | 125458486 | $-37,461,385 | -37461385 |
| 2016 | $96,304,400 | 96304400 | $130,290,910 | 130290910 | $-33,986,510 | -33986510 |
| 2017 | $124,116,166 | 124116166 | $136,573,000 | 136573000 | $-12,456,834 | -12456834 |
| 2018 | $134,851,566 | 134851566 | $135,681,867 | 135681867 | $-830,301 | -830301 |
| 2019 | $119,575,034 | 119575034 | $134,776,225 | 134776225 | $-15,201,191 | -15201191 |
| 2020 | $92,781,066 | 92781066 | $138,321,485 | 138321485 | $-45,540,419 | -45540419 |
| 2021 | $52,028,300 | 52028300 | $129,635,938 | 129635938 | $-77,607,638 | -77607638 |
| 2022 | $68,037,200 | 68037200 | $147,002,411 | 147002411 | $-78,965,211 | -78965211 |
| 2023 | $89,424,629 | 89424629 | $158,155,877 | 158155877 | $-68,731,248 | -68731248 |
| 2024 | $49,621,429 | 49621429 | $133,074,721 | 133074721 | $-83,453,292 | -83453292 |
| 2025 | $45,171,429 | 45171429 | $94,180,059 | 94180059 | $-49,008,630 | -49008630 |
| 2026 | $53,871,429 | 53871429 | $74,818,461 | 74818461 | $-20,947,032 | -20947032 |
| 2027 | $51,571,429 | 51571429 | $56,972,319 | 56972319 | $-5,400,890 | -5400890 |
| 2028 | $48,571,429 | 48571429 | $45,437,759 | 45437759 | $3,133,670 | 3133670 |
| 2029 | $23,571,429 | 23571429 | $37,269,628 | 37269628 | $-13,698,199 | -13698199 |
| 2030 | $2,500,000 | 2500000 | $39,665,769 | 39665769 | $-37,165,769 | -37165769 |
|
 2015 Cleveland Indians