| Player | Player Sort | Pos | Salary | Salary Sort | Pct | Pct Sort | WARP | WARP Sort | WARP/$M | WARP/$M Sort | $/WARP | $/WARP Sort | Current Status |
|---|
 Todd Helton
 |
Helton Todd |
1B |
$16,600,000 |
16600000 |
39.84% |
39.84 |
2.17 |
2.1737 |
0.13 |
0.13094578313253 |
$7,636,748 |
7636748.4013433 |
|
 Vinny Castilla
 |
Castilla Vinny |
PH |
$3,200,000 |
3200000 |
7.68% |
7.68 |
-0.12 |
-0.116549 |
— |
0 |
— |
0 |
|
 Ray King
 |
King Ray |
RP |
$2,450,000 |
2450000 |
5.88% |
5.88 |
-0.47 |
-0.474351 |
— |
0 |
— |
0 |
|
 Jason Jennings
 |
Jennings Jason |
RP |
$2,300,000 |
2300000 |
5.52% |
5.52 |
3.01 |
3.00881 |
1.31 |
1.3081782608696 |
$764,422 |
764421.81460444 |
|
 Jose Mesa
 |
Mesa Jose |
RP |
$2,000,000 |
2000000 |
4.80% |
4.80 |
-0.91 |
-0.914426 |
— |
0 |
— |
0 |
|
 Brian Fuentes
 |
Fuentes Brian |
RP |
$2,000,000 |
2000000 |
4.80% |
4.80 |
1.48 |
1.4769 |
0.74 |
0.73845 |
$1,354,188 |
1354187.8258514 |
|
 Byung-Hyun Kim
 |
Kim Byung-Hyun |
RP |
$1,250,000 |
1250000 |
3.00% |
3.00 |
2.92 |
2.91824 |
2.33 |
2.334592 |
$428,340 |
428340.3695378 |
|
 Aaron Cook
 |
Cook Aaron |
RP |
$1,200,000 |
1200000 |
2.88% |
2.88 |
3.06 |
3.06057 |
2.55 |
2.550475 |
$392,084 |
392083.82752232 |
|
 Mike DeJean
 |
DeJean Mike |
RP |
$1,000,000 |
1000000 |
2.40% |
2.40 |
0.02 |
0.0157606 |
0.02 |
0.0157606 |
$63,449,361 |
63449361.064934 |
|
 Yorvit Torrealba
 |
Torrealba Yorvit |
C |
$850,000 |
850000 |
2.04% |
2.04 |
0.58 |
0.579507 |
0.68 |
0.68177294117647 |
$1,466,764 |
1466763.9907715 |
|
 Jamey Carroll
 |
Carroll Jamey |
2B |
$700,000 |
700000 |
1.68% |
1.68 |
4.34 |
4.3448 |
6.21 |
6.2068571428571 |
$161,112 |
161112.1340453 |
|
 Sun-Woo Kim
 |
Kim Sun-Woo |
RP |
$600,000 |
600000 |
1.44% |
1.44 |
-0.20 |
-0.201976 |
— |
0 |
— |
0 |
|
 Zach Day
 |
Day Zach |
RP |
$600,000 |
600000 |
1.44% |
1.44 |
-0.09 |
-0.0850629 |
— |
0 |
— |
0 |
|
 Tom Martin
 |
Martin Tom |
RP |
$550,000 |
550000 |
1.32% |
1.32 |
1.15 |
1.15248 |
2.10 |
2.0954181818182 |
$477,232 |
477231.70901013 |
|
 Matt Holliday
 |
Holliday Matt |
LF |
$500,000 |
500000 |
1.20% |
1.20 |
5.34 |
5.33518 |
10.67 |
10.67036 |
$93,718 |
93717.550298209 |
|
 Josh Fogg
 |
Fogg Josh |
RP |
$450,000 |
450000 |
1.08% |
1.08 |
0.28 |
0.284694 |
0.63 |
0.63265333333333 |
$1,580,644 |
1580644.4814432 |
|
 David Cortes
 |
Cortes David |
RP |
$360,000 |
360000 |
0.86% |
0.86 |
0.01 |
0.0125412 |
0.03 |
0.034836666666667 |
$28,705,387 |
28705387.044302 |
|
 Miguel Ojeda
 |
Ojeda Miguel |
C |
$350,000 |
350000 |
0.84% |
0.84 |
-0.13 |
-0.13132 |
— |
0 |
— |
0 |
|
 Eli Marrero
 |
Marrero Eli |
PH |
$350,000 |
350000 |
0.84% |
0.84 |
0.33 |
0.332729 |
0.95 |
0.95065428571429 |
$1,051,907 |
1051907.1075861 |
|
 Luis Gonzalez
 |
Gonzalez Luis |
2B |
$345,000 |
345000 |
0.83% |
0.83 |
-0.71 |
-0.714579 |
— |
0 |
— |
0 |
|
 Jaime Cerda
 |
Cerda Jaime |
DNP |
$342,000 |
342000 |
0.82% |
0.82 |
— |
0.00 |
— |
0 |
— |
0 |
|
 Jeff Francis
 |
Francis Jeff |
RP |
$336,000 |
336000 |
0.81% |
0.81 |
3.16 |
3.16071 |
9.41 |
9.406875 |
$106,305 |
106305.22888845 |
|
 Garrett Atkins
 |
Atkins Garrett |
3B |
$335,000 |
335000 |
0.80% |
0.80 |
4.82 |
4.82356 |
14.40 |
14.398686567164 |
$69,451 |
69450.77909262 |
|
 Cory Sullivan
 |
Sullivan Cory |
CF |
$335,000 |
335000 |
0.80% |
0.80 |
0.56 |
0.560423 |
1.67 |
1.6729044776119 |
$597,763 |
597762.76134277 |
|
 Clint Barmes
 |
Barmes Clint |
SS |
$335,000 |
335000 |
0.80% |
0.80 |
-0.81 |
-0.811244 |
— |
0 |
— |
0 |
|
 Jorge Piedra
 |
Piedra Jorge |
PH |
$335,000 |
335000 |
0.80% |
0.80 |
-0.44 |
-0.436144 |
— |
0 |
— |
0 |
|
 Jason Smith
 |
Smith Jason |
PH |
$335,000 |
335000 |
0.80% |
0.80 |
0.27 |
0.273425 |
0.82 |
0.81619402985075 |
$1,225,199 |
1225198.8662339 |
|
 Danny Ardoin
 |
Ardoin Danny |
C |
$335,000 |
335000 |
0.80% |
0.80 |
-0.90 |
-0.898997 |
— |
0 |
— |
0 |
Arb2/2011, Arb3/2012, FA/2013 |
 Scott Dohmann
 |
Dohmann Scott |
RP |
$333,000 |
333000 |
0.80% |
0.80 |
0.25 |
0.250247 |
0.75 |
0.75149249249249 |
$1,330,685 |
1330685.2829405 |
|
 Chin-hui Tsao
 |
Tsao Chin-hui |
DNP |
$332,000 |
332000 |
0.80% |
0.80 |
— |
0.00 |
— |
0 |
— |
0 |
|
 Ryan Shealy
 |
Shealy Ryan |
PH |
$329,000 |
329000 |
0.79% |
0.79 |
-0.03 |
-0.0309377 |
— |
0 |
— |
0 |
Arb2/2011, Arb3/2012, FA/2013 |
 Choo Freeman
 |
Freeman Choo |
CF |
$329,000 |
329000 |
0.79% |
0.79 |
0.29 |
0.287483 |
0.87 |
0.8738085106383 |
$1,144,415 |
1144415.4958728 |
|
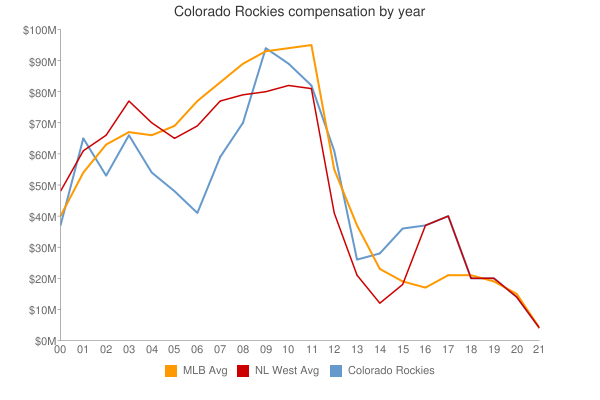
| Year | Rockies payroll |
PR Sort |
Avg payroll |
AvgPR Sort |
Diff |
Diff Sort |
|---|
| 2000 | $61,258,690 | 61258690 | $56,164,089 | 56164089 | $5,094,601 | 5094601 |
| 2001 | $71,198,334 | 71198334 | $65,991,638 | 65991638 | $5,206,696 | 5206696 |
| 2002 | $54,206,543 | 54206543 | $68,244,471 | 68244471 | $-14,037,928 | -14037928 |
| 2003 | $65,830,000 | 65830000 | $71,318,479 | 71318479 | $-5,488,479 | -5488479 |
| 2004 | $63,788,500 | 63788500 | $70,466,961 | 70466961 | $-6,678,461 | -6678461 |
| 2005 | $57,115,500 | 57115500 | $73,264,780 | 73264780 | $-16,149,280 | -16149280 |
| 2006 | $41,666,000 | 41666000 | $79,051,754 | 79051754 | $-37,385,754 | -37385754 |
| 2007 | $57,062,000 | 57062000 | $83,931,138 | 83931138 | $-26,869,138 | -26869138 |
| 2008 | $69,856,500 | 69856500 | $90,812,373 | 90812373 | $-20,955,873 | -20955873 |
| 2009 | $75,605,533 | 75605533 | $91,093,211 | 91093211 | $-15,487,678 | -15487678 |
| 2010 | $84,618,333 | 84618333 | $93,373,681 | 93373681 | $-8,755,348 | -8755348 |
| 2011 | $82,311,404 | 82311404 | $96,102,034 | 96102034 | $-13,790,630 | -13790630 |
| 2012 | $80,164,571 | 80164571 | $100,657,138 | 100657138 | $-20,492,567 | -20492567 |
| 2013 | $74,624,071 | 74624071 | $109,024,990 | 109024990 | $-34,400,919 | -34400919 |
| 2014 | $93,581,071 | 93581071 | $117,828,782 | 117828782 | $-24,247,711 | -24247711 |
| 2015 | $97,069,630 | 97069630 | $127,404,244 | 127404244 | $-30,334,614 | -30334614 |
| 2016 | $112,645,071 | 112645071 | $132,219,407 | 132219407 | $-19,574,336 | -19574336 |
| 2017 | $127,828,571 | 127828571 | $137,302,894 | 137302894 | $-9,474,323 | -9474323 |
| 2018 | $136,953,500 | 136953500 | $136,929,168 | 136929168 | $24,332 | 24332 |
| 2019 | $145,248,500 | 145248500 | $136,944,257 | 136944257 | $8,304,243 | 8304243 |
| 2020 | $154,949,500 | 154949500 | $140,677,788 | 140677788 | $14,271,712 | 14271712 |
| 2021 | $119,764,000 | 119764000 | $132,162,631 | 132162631 | $-12,398,631 | -12398631 |
| 2022 | $150,070,000 | 150070000 | $149,374,046 | 149374046 | $695,954 | 695954 |
| 2023 | $149,598,000 | 149598000 | $160,460,390 | 160460390 | $-10,862,390 | -10862390 |
| 2024 | $125,739,286 | 125739286 | $135,504,022 | 135504022 | $-9,764,736 | -9764736 |
| 2025 | $89,714,286 | 89714286 | $96,417,302 | 96417302 | $-6,703,016 | -6703016 |
| 2026 | $81,964,286 | 81964286 | $76,694,120 | 76694120 | $5,270,166 | 5270166 |
| 2027 | $51,214,286 | 51214286 | $58,935,617 | 58935617 | $-7,721,331 | -7721331 |
| 2028 | $38,214,286 | 38214286 | $45,437,759 | 45437759 | $-7,223,473 | -7223473 |
| 2029 | $14,214,286 | 14214286 | $37,269,628 | 37269628 | $-23,055,342 | -23055342 |
| 2030 | $16,214,286 | 16214286 | $39,665,769 | 39665769 | $-23,451,483 | -23451483 |
| 2031 | $2,500,000 | 2500000 | $38,360,152 | 38360152 | $-35,860,152 | -35860152 |
|
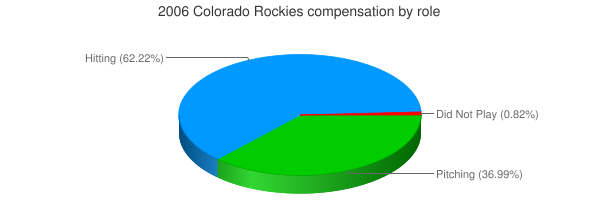
 2006 Colorado Rockies